final version of the self-study document - Keuka College's Middle ...
final version of the self-study document - Keuka College's Middle ...
final version of the self-study document - Keuka College's Middle ...

Create successful ePaper yourself
Turn your PDF publications into a flip-book with our unique Google optimized e-Paper software.
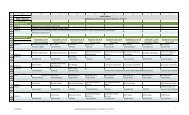
Retention and Graduation Rates<br />
The tables below provide retention and graduation rates across <strong>the</strong> College’s four formats. A<br />
more complete analysis <strong>of</strong> ASAP graduation rates by academic program, both undergraduate and<br />
graduate can be found in Appendix 5.20 ASAP Programs Cohort Graduation Rates Analysis<br />
2002-2003 to 2010-2011.<br />
Table 5.11 Retention for Traditional Campus Program<br />
Benchmark<br />
Freshmen<br />
fall to fall<br />
Overall fall<br />
to fall<br />
Diversity<br />
Retention<br />
fall to fall<br />
2005-<br />
2006<br />
2006-<br />
2007<br />
2007-<br />
2008<br />
2008-<br />
2009<br />
2009-<br />
2010<br />
2010-<br />
2011<br />
2011-<br />
2012<br />
2012-<br />
2013<br />
72.9% 69.8% 64.0% 68.9% 62.9% 68.1% 70.9% 73.9%<br />
86.0% 82.9% 82.4% 82.0% 81.7% 83.0% 83.5% 85%<br />
46.2% 48.6% 57.6% 50.0% 62.1% 60.1% 60.0% 60.0%<br />
Table 5.12 Retention for ASAP Undergraduate and Graduate Program Years 2002-2011<br />
Program<br />
End<br />
Year<br />
Original<br />
#<br />
<strong>of</strong><br />
Students<br />
Withdrew Cohort<br />
Retention<br />
Net <strong>of</strong><br />
Withdrwls<br />
2002-03 65 14 78.5%<br />
2003-04 86 19 77.9%<br />
+0 year<br />
after<br />
end <strong>of</strong><br />
program<br />
+1 year<br />
after end<br />
<strong>of</strong><br />
program<br />
+2 year<br />
after<br />
end <strong>of</strong><br />
progrm<br />
+3 year<br />
after<br />
end <strong>of</strong><br />
progrm<br />
+4 year<br />
after<br />
end <strong>of</strong><br />
progrm<br />
+5 year<br />
after<br />
end <strong>of</strong><br />
progrm<br />
2004-05 180 30 83.3% 77.8%<br />
2005-06 207 27 87.0% 80.7% 84.1%<br />
2006-07 255 46 82.0% 78.0% 78.4%<br />
2007-08 340 72 78.8% 74.4% 74.7%<br />
2008-09 358 45 87.4% 75.7% 78.8%<br />
2009-10 381 76 80.1% 60.9% 74.0%<br />
2010-11 464 106 77.2% 62.3%<br />
Page 27 <strong>of</strong> 39 Chapter 5: Admissions, Retention & Support