VOLUM OMAGIAL - Facultatea de Ştiinţe ale Naturii şi Ştiinţe Agricole
VOLUM OMAGIAL - Facultatea de Ştiinţe ale Naturii şi Ştiinţe Agricole
VOLUM OMAGIAL - Facultatea de Ştiinţe ale Naturii şi Ştiinţe Agricole

You also want an ePaper? Increase the reach of your titles
YUMPU automatically turns print PDFs into web optimized ePapers that Google loves.
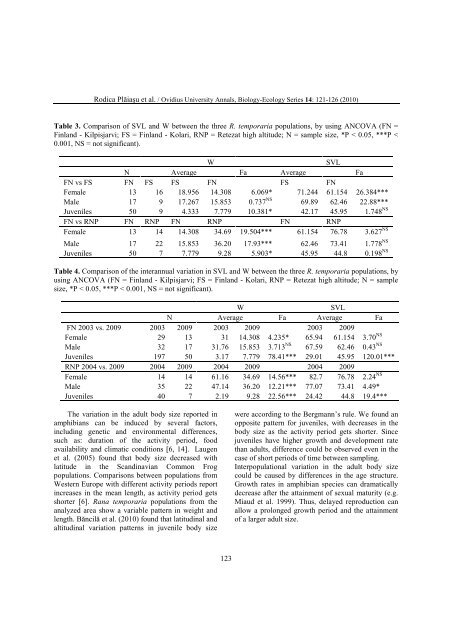
Rodica Plăiaşu et al. / Ovidius University Annals, Biology-Ecology Series 14: 121-126 (2010)<br />
Table 3. Comparison of SVL and W between the three R. temporaria populations, by using ANCOVA (FN =<br />
Finland - Kilpisjarvi; FS = Finland - Kolari, RNP = Retezat high altitu<strong>de</strong>; N = sample size, *P < 0.05, ***P <<br />
0.001, NS = not significant).<br />
W SVL<br />
N Average Fa Average Fa<br />
FN vs FS FN FS FS FN FS FN<br />
Fem<strong>ale</strong> 13 16 18.956 14.308 6.069* 71.244 61.154 26.384***<br />
M<strong>ale</strong> 17 9 17.267 15.853 0.737 NS<br />
69.89 62.46 22.88***<br />
Juveniles 50 9 4.333 7.779 10.381* 42.17 45.95 1.748 NS<br />
FN vs RNP FN RNP FN RNP FN RNP<br />
Fem<strong>ale</strong> 13 14 14.308 34.69 19.504*** 61.154 76.78 3.627 NS<br />
M<strong>ale</strong> 17 22 15.853 36.20 17.93*** 62.46 73.41 1.778 NS<br />
Juveniles 50 7 7.779 9.28 5.903* 45.95 44.8 0.198 NS<br />
Table 4. Comparison of the interannual variation in SVL and W between the three R. temporaria populations, by<br />
using ANCOVA (FN = Finland - Kilpisjarvi; FS = Finland - Kolari, RNP = Retezat high altitu<strong>de</strong>; N = sample<br />
size, *P < 0.05, ***P < 0.001, NS = not significant).<br />
W SVL<br />
N Average Fa Average Fa<br />
FN 2003 vs. 2009 2003 2009 2003 2009 2003 2009<br />
Fem<strong>ale</strong> 29 13 31 14.308 4.235* 65.94 61.154 3.70 NS<br />
M<strong>ale</strong> 32 17 31.76 15.853 3.713 NS<br />
67.59 62.46 0.43 NS<br />
Juveniles 197 50 3.17 7.779 78.41*** 29.01 45.95 120.01***<br />
RNP 2004 vs. 2009 2004 2009 2004 2009 2004 2009<br />
Fem<strong>ale</strong> 14 14 61.16 34.69 14.56*** 82.7 76.78 2.24 NS<br />
M<strong>ale</strong> 35 22 47.14 36.20 12.21*** 77.07 73.41 4.49*<br />
Juveniles 40 7 2.19 9.28 22.56*** 24.42 44.8 19.4***<br />
The variation in the adult body size reported in<br />
amphibians can be induced by several factors,<br />
including genetic and environmental differences,<br />
such as: duration of the activity period, food<br />
availability and climatic conditions [6, 14]. Laugen<br />
et al. (2005) found that body size <strong>de</strong>creased with<br />
latitu<strong>de</strong> in the Scandinavian Common Frog<br />
populations. Comparisons between populations from<br />
Western Europe with different activity periods report<br />
increases in the mean length, as activity period gets<br />
shorter [6]. Rana temporaria populations from the<br />
analyzed area show a variable pattern in weight and<br />
length. Băncilă et al. (2010) found that latitudinal and<br />
altitudinal variation patterns in juvenile body size<br />
123<br />
were according to the Bergmann’s rule. We found an<br />
opposite pattern for juveniles, with <strong>de</strong>creases in the<br />
body size as the activity period gets shorter. Since<br />
juveniles have higher growth and <strong>de</strong>velopment rate<br />
than adults, difference could be observed even in the<br />
case of short periods of time between sampling.<br />
Interpopulational variation in the adult body size<br />
could be caused by differences in the age structure.<br />
Growth rates in amphibian species can dramatically<br />
<strong>de</strong>crease after the attainment of sexual maturity (e.g.<br />
Miaud et al. 1999). Thus, <strong>de</strong>layed reproduction can<br />
allow a prolonged growth period and the attainment<br />
of a larger adult size.