VOLUM OMAGIAL - Facultatea de Ştiinţe ale Naturii şi Ştiinţe Agricole
VOLUM OMAGIAL - Facultatea de Ştiinţe ale Naturii şi Ştiinţe Agricole
VOLUM OMAGIAL - Facultatea de Ştiinţe ale Naturii şi Ştiinţe Agricole

Create successful ePaper yourself
Turn your PDF publications into a flip-book with our unique Google optimized e-Paper software.
Changes in bacterial abundance and biomass... / Ovidius University Annals, Biology-Ecology Series 14: 139-145 (2010)<br />
Biomass (µg)<br />
3.5<br />
3<br />
2.5<br />
2<br />
1.5<br />
1<br />
0 14 28 42 56<br />
Time (days)<br />
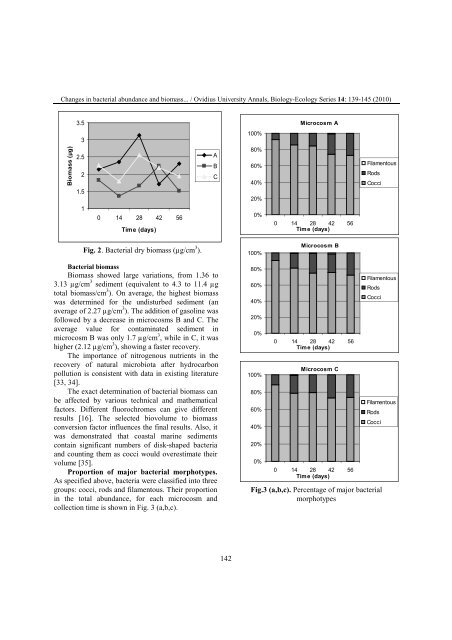
Fig. 2. Bacterial dry biomass (µg/cm 3 ).<br />
Bacterial biomass<br />
Biomass showed large variations, from 1.36 to<br />
3.13 µg/cm 3 sediment (equiv<strong>ale</strong>nt to 4.3 to 11.4 µg<br />
total biomass/cm 3 ). On average, the highest biomass<br />
was <strong>de</strong>termined for the undisturbed sediment (an<br />
average of 2.27 µg/cm 3 ). The addition of gasoline was<br />
followed by a <strong>de</strong>crease in microcosms B and C. The<br />
average value for contaminated sediment in<br />
microcosm B was only 1.7 µg/cm 3 , while in C, it was<br />
higher (2.12 µg/cm 3 ), showing a faster recovery.<br />
The importance of nitrogenous nutrients in the<br />
recovery of natural microbiota after hydrocarbon<br />
pollution is consistent with data in existing literature<br />
[33, 34].<br />
The exact <strong>de</strong>termination of bacterial biomass can<br />
be affected by various technical and mathematical<br />
factors. Different fluorochromes can give different<br />
results [16]. The selected biovolume to biomass<br />
conversion factor influences the final results. Also, it<br />
was <strong>de</strong>monstrated that coastal marine sediments<br />
contain significant numbers of disk-shaped bacteria<br />
and counting them as cocci would overestimate their<br />
volume [35].<br />
Proportion of major bacterial morphotypes.<br />
As specified above, bacteria were classified into three<br />
groups: cocci, rods and filamentous. Their proportion<br />
in the total abundance, for each microcosm and<br />
collection time is shown in Fig. 3 (a,b,c).<br />
A<br />
B<br />
C<br />
142<br />
100%<br />
80%<br />
60%<br />
40%<br />
20%<br />
0%<br />
100%<br />
80%<br />
60%<br />
40%<br />
20%<br />
0%<br />
100%<br />
80%<br />
60%<br />
40%<br />
20%<br />
0%<br />
Microcosm A<br />
0 14 28 42 56<br />
Time (days)<br />
Microcosm B<br />
0 14 28 42 56<br />
Time (days)<br />
Microcosm C<br />
0 14 28 42 56<br />
Time (days)<br />
Filamentous<br />
Rods<br />
Cocci<br />
Filamentous<br />
Rods<br />
Cocci<br />
Filamentous<br />
Rods<br />
Cocci<br />
Fig.3 (a,b,c). Percentage of major bacterial<br />
morphotypes