VOLUM OMAGIAL - Facultatea de Ştiinţe ale Naturii şi Ştiinţe Agricole
VOLUM OMAGIAL - Facultatea de Ştiinţe ale Naturii şi Ştiinţe Agricole
VOLUM OMAGIAL - Facultatea de Ştiinţe ale Naturii şi Ştiinţe Agricole

You also want an ePaper? Increase the reach of your titles
YUMPU automatically turns print PDFs into web optimized ePapers that Google loves.
Utilization of epifluorescence microscopy…/ Ovidius University Annals, Biology-Ecology Series 14: 127-137 (2010)<br />
algorithms of CellC software for digital images,<br />
because this have three important parts: a MATLAB<br />
figure file of the segmented image (this can be<br />
exported in any common image file format; a comma<br />
separated value (CSV) - file with quantitative data of<br />
the cells (was opened in a spreadsheet program Excel<br />
for further analysis); a summary CSV-file with the<br />
cell count for each of the analyzed images for a quick<br />
overview of the analysis process (this file were only<br />
saved in the batch processing mo<strong>de</strong>). Fluorescence<br />
microscopy digital images were analyzed and the<br />
objects has different intensity than the background.<br />
Commonly, this property holds true for images of<br />
bacteria (http://sites.google.com/site/cellcsoftware/).<br />
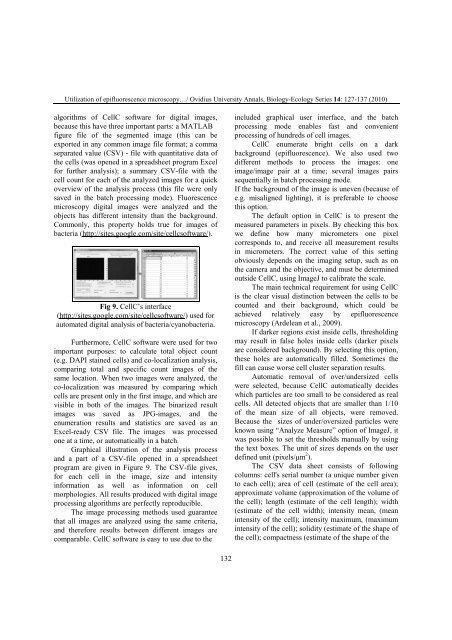
Fig 9. CellC’s interface<br />
(http://sites.google.com/site/cellcsoftware/) used for<br />
automated digital analysis of bacteria/cyanobacteria.<br />
Furthermore, CellC software were used for two<br />
important purposes: to calculate total object count<br />
(e.g. DAPI stained cells) and co-localization analysis,<br />
comparing total and specific count images of the<br />
same location. When two images were analyzed, the<br />
co-localization was measured by comparing which<br />
cells are present only in the first image, and which are<br />
visible in both of the images. The binarized result<br />
images was saved as JPG-images, and the<br />
enumeration results and statistics are saved as an<br />
Excel-ready CSV file. The images was processed<br />
one at a time, or automatically in a batch.<br />
Graphical illustration of the analysis process<br />
and a part of a CSV-file opened in a spreadsheet<br />
program are given in Figure 9. The CSV-file gives,<br />
for each cell in the image, size and intensity<br />
information as well as information on cell<br />
morphologies. All results produced with digital image<br />
processing algorithms are perfectly reproducible.<br />
The image processing methods used guarantee<br />
that all images are analyzed using the same criteria,<br />
and therefore results between different images are<br />
comparable. CellC software is easy to use due to the<br />
132<br />
inclu<strong>de</strong>d graphical user interface, and the batch<br />
processing mo<strong>de</strong> enables fast and convenient<br />
processing of hundreds of cell images.<br />
CellC enumerate bright cells on a dark<br />
background (epifluorescence). We also used two<br />
different methods to process the images: one<br />
image/image pair at a time; several images pairs<br />
sequentially in batch processing mo<strong>de</strong>.<br />
If the background of the image is uneven (because of<br />
e.g. misaligned lighting), it is preferable to choose<br />
this option.<br />
The <strong>de</strong>fault option in CellC is to present the<br />
measured parameters in pixels. By checking this box<br />
we <strong>de</strong>fine how many micrometers one pixel<br />
corresponds to, and receive all measurement results<br />
in micrometers. The correct value of this setting<br />
obviously <strong>de</strong>pends on the imaging setup, such as on<br />
the camera and the objective, and must be <strong>de</strong>termined<br />
outsi<strong>de</strong> CellC, using ImageJ to calibrate the sc<strong>ale</strong>.<br />
The main technical requirement for using CellC<br />
is the clear visual distinction between the cells to be<br />
counted and their background, which could be<br />
achieved relatively easy by epifluorescence<br />
microscopy (Ar<strong>de</strong>lean et al., 2009).<br />
If darker regions exist insi<strong>de</strong> cells, thresholding<br />
may result in false holes insi<strong>de</strong> cells (darker pixels<br />
are consi<strong>de</strong>red background). By selecting this option,<br />
these holes are automatically filled. Sometimes the<br />
fill can cause worse cell cluster separation results.<br />
Automatic removal of over/un<strong>de</strong>rsized cells<br />
were selected, because CellC automatically <strong>de</strong>ci<strong>de</strong>s<br />
which particles are too small to be consi<strong>de</strong>red as real<br />
cells. All <strong>de</strong>tected objects that are smaller than 1/10<br />
of the mean size of all objects, were removed.<br />
Because the sizes of un<strong>de</strong>r/oversized particles were<br />
known using “Analyze Measure” option of ImageJ, it<br />
was possible to set the thresholds manually by using<br />
the text boxes. The unit of sizes <strong>de</strong>pends on the user<br />
<strong>de</strong>fined unit (pixels/μm 2 ).<br />
The CSV data sheet consists of following<br />
columns: cell's serial number (a unique number given<br />
to each cell); area of cell (estimate of the cell area);<br />
approximate volume (approximation of the volume of<br />
the cell); length (estimate of the cell length); width<br />
(estimate of the cell width); intensity mean, (mean<br />
intensity of the cell); intensity maximum, (maximum<br />
intensity of the cell); solidity (estimate of the shape of<br />
the cell); compactness (estimate of the shape of the