PostGIS Raster : Extending PostgreSQL for The Support of ... - CoDE
PostGIS Raster : Extending PostgreSQL for The Support of ... - CoDE
PostGIS Raster : Extending PostgreSQL for The Support of ... - CoDE

You also want an ePaper? Increase the reach of your titles
YUMPU automatically turns print PDFs into web optimized ePapers that Google loves.
2.2.4 Surfaces<br />
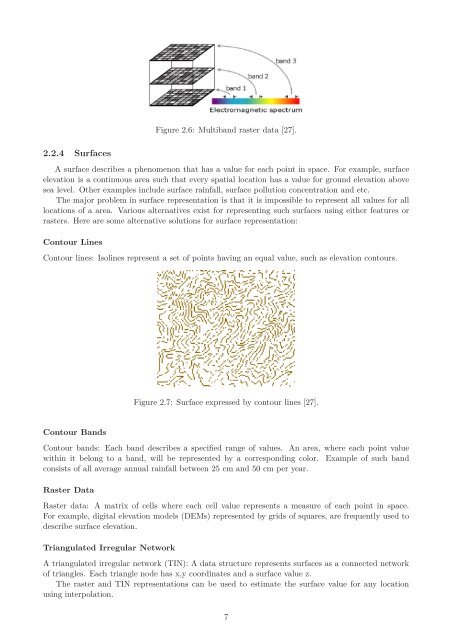
Figure 2.6: Multiband raster data [27].<br />
A surface describes a phenomenon that has a value <strong>for</strong> each point in space. For example, surface<br />
elevation is a continuous area such that every spatial location has a value <strong>for</strong> ground elevation above<br />
sea level. Other examples include surface rainfall, surface pollution concentration and etc.<br />
<strong>The</strong> major problem in surface representation is that it is impossible to represent all values <strong>for</strong> all<br />
locations <strong>of</strong> a area. Various alternatives exist <strong>for</strong> representing such surfaces using either features or<br />
rasters. Here are some alternative solutions <strong>for</strong> surface representation:<br />
Contour Lines<br />
Contour lines: Isolines represent a set <strong>of</strong> points having an equal value, such as elevation contours.<br />
Contour Bands<br />
Figure 2.7: Surface expressed by contour lines [27].<br />
Contour bands: Each band describes a specified range <strong>of</strong> values. An area, where each point value<br />
within it belong to a band, will be represented by a corresponding color. Example <strong>of</strong> such band<br />
consists <strong>of</strong> all average annual rainfall between 25 cm and 50 cm per year.<br />
<strong>Raster</strong> Data<br />
<strong>Raster</strong> data: A matrix <strong>of</strong> cells where each cell value represents a measure <strong>of</strong> each point in space.<br />
For example, digital elevation models (DEMs) represented by grids <strong>of</strong> squares, are frequently used to<br />
describe surface elevation.<br />
Triangulated Irregular Network<br />
A triangulated irregular network (TIN): A data structure represents surfaces as a connected network<br />
<strong>of</strong> triangles. Each triangle node has x,y coordinates and a surface value z.<br />
<strong>The</strong> raster and TIN representations can be used to estimate the surface value <strong>for</strong> any location<br />
using interpolation.<br />
7