PostGIS Raster : Extending PostgreSQL for The Support of ... - CoDE
PostGIS Raster : Extending PostgreSQL for The Support of ... - CoDE
PostGIS Raster : Extending PostgreSQL for The Support of ... - CoDE
You also want an ePaper? Increase the reach of your titles
YUMPU automatically turns print PDFs into web optimized ePapers that Google loves.
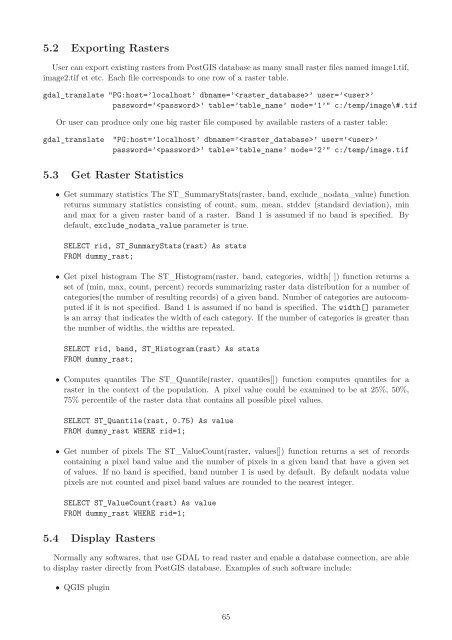
5.2 Exporting <strong>Raster</strong>s<br />
User can export existing rasters from <strong>PostGIS</strong> database as many small raster files named image1.tif,<br />
image2.tif et etc. Each file corresponds to one row <strong>of</strong> a raster table.<br />
gdal_translate "PG:host=’localhost’ dbname=’’ user=’’<br />
password=’’ table=’table_name’ mode=’1’" c:/temp/image\#.tif<br />
Or user can produce only one big raster file composed by available rasters <strong>of</strong> a raster table:<br />
gdal_translate "PG:host=’localhost’ dbname=’’ user=’’<br />
password=’’ table=’table_name’ mode=’2’" c:/temp/image.tif<br />
5.3 Get <strong>Raster</strong> Statistics<br />
• Get summary statistics <strong>The</strong> ST_SummaryStats(raster, band, exclude_nodata_value) function<br />
returns summary statistics consisting <strong>of</strong> count, sum, mean, stddev (standard deviation), min<br />
and max <strong>for</strong> a given raster band <strong>of</strong> a raster. Band 1 is assumed if no band is specified. By<br />
default, exclude_nodata_value parameter is true.<br />
SELECT rid, ST_SummaryStats(rast) As stats<br />
FROM dummy_rast;<br />
• Get pixel histogram <strong>The</strong> ST_Histogram(raster, band, categories, width[ ]) function returns a<br />
set <strong>of</strong> (min, max, count, percent) records summarizing raster data distribution <strong>for</strong> a number <strong>of</strong><br />
categories(the number <strong>of</strong> resulting records) <strong>of</strong> a given band. Number <strong>of</strong> categories are autocomputed<br />
if it is not specified. Band 1 is assumed if no band is specified. <strong>The</strong> width[] parameter<br />
is an array that indicates the width <strong>of</strong> each category. If the number <strong>of</strong> categories is greater than<br />
the number <strong>of</strong> widths, the widths are repeated.<br />
SELECT rid, band, ST_Histogram(rast) As stats<br />
FROM dummy_rast;<br />
• Computes quantiles <strong>The</strong> ST_Quantile(raster, quantiles[]) function computes quantiles <strong>for</strong> a<br />
raster in the context <strong>of</strong> the population. A pixel value could be examined to be at 25%, 50%,<br />
75% percentile <strong>of</strong> the raster data that contains all possible pixel values.<br />
SELECT ST_Quantile(rast, 0.75) As value<br />
FROM dummy_rast WHERE rid=1;<br />
• Get number <strong>of</strong> pixels <strong>The</strong> ST_ValueCount(raster, values[]) function returns a set <strong>of</strong> records<br />
containing a pixel band value and the number <strong>of</strong> pixels in a given band that have a given set<br />
<strong>of</strong> values. If no band is specified, band number 1 is used by default. By default nodata value<br />
pixels are not counted and pixel band values are rounded to the nearest integer.<br />
SELECT ST_ValueCount(rast) As value<br />
FROM dummy_rast WHERE rid=1;<br />
5.4 Display <strong>Raster</strong>s<br />
Normally any s<strong>of</strong>twares, that use GDAL to read raster and enable a database connection, are able<br />
to display raster directly from <strong>PostGIS</strong> database. Examples <strong>of</strong> such s<strong>of</strong>tware include:<br />
• QGIS plugin<br />
65


