PostGIS Raster : Extending PostgreSQL for The Support of ... - CoDE
PostGIS Raster : Extending PostgreSQL for The Support of ... - CoDE
PostGIS Raster : Extending PostgreSQL for The Support of ... - CoDE

You also want an ePaper? Increase the reach of your titles
YUMPU automatically turns print PDFs into web optimized ePapers that Google loves.
<strong>The</strong> multi-band conception is resulted from the fact that, in practice, a raster image can contain<br />
multiple bands. For example, electromagnetic wave data from remote sensing devices is grouped into<br />
a certain number <strong>of</strong> channels, where the number <strong>of</strong> possible channels depends on the capacities <strong>of</strong> the<br />
sensing device. Or, multispectral images contain multiple channels and hyperspectral images contain<br />
environ 50 or more channels. <strong>The</strong>n by using raster type to model such data in a geographic in<strong>for</strong>mation<br />
system, each channel is expressed by a band.<br />
Some rasters have a single band <strong>of</strong> data, while others have multiple bands. Basically, a band<br />
is represented by a single matrix <strong>of</strong> cell values and a raster with multiple bands contains multiple<br />
coincident matrices <strong>of</strong> cell values representing the same spatial area. An example <strong>of</strong> a single-band raster<br />
dataset is a digital elevation model (DEM). Each cell in a DEM contains only one value representing<br />
surface elevation. Most satellite imagery has multiple bands, typically containing values within a range<br />
or band <strong>of</strong> the electromagnetic spectrum.<br />
<strong>The</strong>re are three main ways to display single-band raster data:<br />
• Using two colors: In a binary image, each cell has a value <strong>of</strong> 0 or 1 and is <strong>of</strong>ten displayed using<br />
black and white. This type <strong>of</strong> display is <strong>of</strong>ten used <strong>for</strong> displaying scanned maps with simple line<br />
work such as parcel maps.<br />
• Grayscale: In a grayscale image, each cell has a value from 0 to 255 or 65535. <strong>The</strong>se are <strong>of</strong>ten<br />
used <strong>for</strong> black and white aerial photographs.<br />
• Color map: One way to represent colors on an image is using a color map. A set <strong>of</strong> values is<br />
coded to match a defined set <strong>of</strong> red, green and blue (RGB) values.<br />
Figure 4.24: Three main ways to display single-band raster [35].<br />
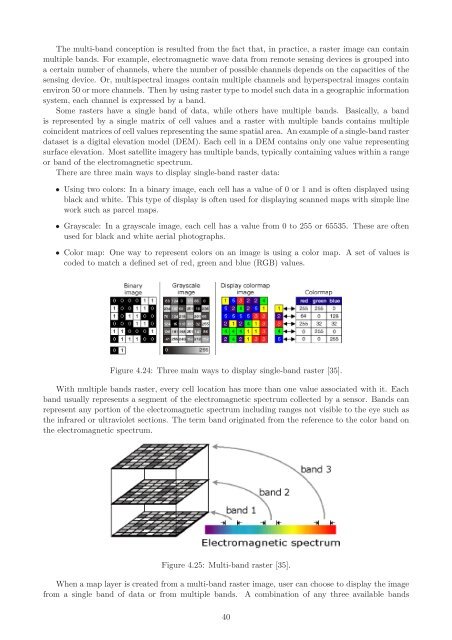
With multiple bands raster, every cell location has more than one value associated with it. Each<br />
band usually represents a segment <strong>of</strong> the electromagnetic spectrum collected by a sensor. Bands can<br />
represent any portion <strong>of</strong> the electromagnetic spectrum including ranges not visible to the eye such as<br />
the infrared or ultraviolet sections. <strong>The</strong> term band originated from the reference to the color band on<br />
the electromagnetic spectrum.<br />
Figure 4.25: Multi-band raster [35].<br />
When a map layer is created from a multi-band raster image, user can choose to display the image<br />
from a single band <strong>of</strong> data or from multiple bands. A combination <strong>of</strong> any three available bands<br />
40