PostGIS Raster : Extending PostgreSQL for The Support of ... - CoDE
PostGIS Raster : Extending PostgreSQL for The Support of ... - CoDE
PostGIS Raster : Extending PostgreSQL for The Support of ... - CoDE

You also want an ePaper? Increase the reach of your titles
YUMPU automatically turns print PDFs into web optimized ePapers that Google loves.
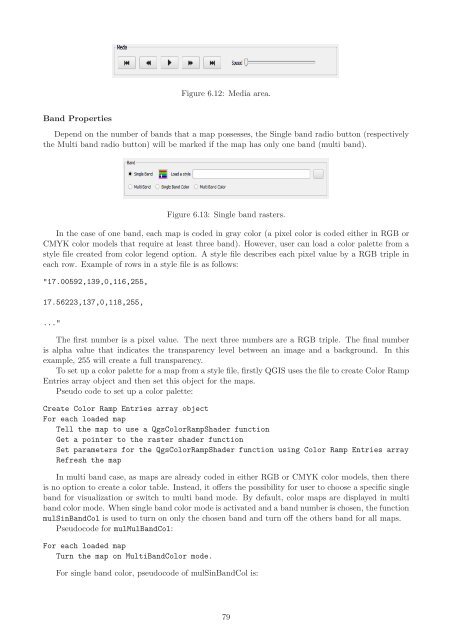
Band Properties<br />
Figure 6.12: Media area.<br />
Depend on the number <strong>of</strong> bands that a map possesses, the Single band radio button (respectively<br />
the Multi band radio button) will be marked if the map has only one band (multi band).<br />
Figure 6.13: Single band rasters.<br />
In the case <strong>of</strong> one band, each map is coded in gray color (a pixel color is coded either in RGB or<br />
CMYK color models that require at least three band). However, user can load a color palette from a<br />
style file created from color legend option. A style file describes each pixel value by a RGB triple in<br />
each row. Example <strong>of</strong> rows in a style file is as follows:<br />
"17.00592,139,0,116,255,<br />
17.56223,137,0,118,255,<br />
..."<br />
<strong>The</strong> first number is a pixel value. <strong>The</strong> next three numbers are a RGB triple. <strong>The</strong> final number<br />
is alpha value that indicates the transparency level between an image and a background. In this<br />
example, 255 will create a full transparency.<br />
To set up a color palette <strong>for</strong> a map from a style file, firstly QGIS uses the file to create Color Ramp<br />
Entries array object and then set this object <strong>for</strong> the maps.<br />
Pseudo code to set up a color palette:<br />
Create Color Ramp Entries array object<br />
For each loaded map<br />
Tell the map to use a QgsColorRampShader function<br />
Get a pointer to the raster shader function<br />
Set parameters <strong>for</strong> the QgsColorRampShader function using Color Ramp Entries array<br />
Refresh the map<br />
In multi band case, as maps are already coded in either RGB or CMYK color models, then there<br />
is no option to create a color table. Instead, it <strong>of</strong>fers the possibility <strong>for</strong> user to choose a specific single<br />
band <strong>for</strong> visualization or switch to multi band mode. By default, color maps are displayed in multi<br />
band color mode. When single band color mode is activated and a band number is chosen, the function<br />
mulSinBandCol is used to turn on only the chosen band and turn <strong>of</strong>f the others band <strong>for</strong> all maps.<br />
Pseudocode <strong>for</strong> mulMulBandCol:<br />
For each loaded map<br />
Turn the map on MultiBandColor mode.<br />
For single band color, pseudocode <strong>of</strong> mulSinBandCol is:<br />
79