Traffic Assessment - Renfrewshire Council
Traffic Assessment - Renfrewshire Council
Traffic Assessment - Renfrewshire Council

Create successful ePaper yourself
Turn your PDF publications into a flip-book with our unique Google optimized e-Paper software.
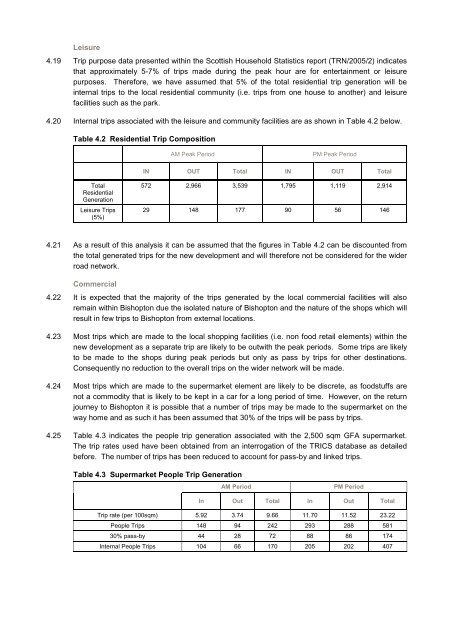
Leisure<br />
4.19 Trip purpose data presented within the Scottish Household Statistics report (TRN/2005/2) indicates<br />
that approximately 5-7% of trips made during the peak hour are for entertainment or leisure<br />
purposes. Therefore, we have assumed that 5% of the total residential trip generation will be<br />
internal trips to the local residential community (i.e. trips from one house to another) and leisure<br />
facilities such as the park.<br />
4.20 Internal trips associated with the leisure and community facilities are as shown in Table 4.2 below.<br />
Table 4.2 Residential Trip Composition<br />
Total<br />
Residential<br />
Generation<br />
Leisure Trips<br />
(5%)<br />
AM Peak Period PM Peak Period<br />
IN OUT Total IN OUT Total<br />
572 2,966 3,539 1,795 1,119 2,914<br />
29 148 177 90 56 146<br />
4.21 As a result of this analysis it can be assumed that the figures in Table 4.2 can be discounted from<br />
the total generated trips for the new development and will therefore not be considered for the wider<br />
road network.<br />
Commercial<br />
4.22 It is expected that the majority of the trips generated by the local commercial facilities will also<br />
remain within Bishopton due the isolated nature of Bishopton and the nature of the shops which will<br />
result in few trips to Bishopton from external locations.<br />
4.23 Most trips which are made to the local shopping facilities (i.e. non food retail elements) within the<br />
new development as a separate trip are likely to be outwith the peak periods. Some trips are likely<br />
to be made to the shops during peak periods but only as pass by trips for other destinations.<br />
Consequently no reduction to the overall trips on the wider network will be made.<br />
4.24 Most trips which are made to the supermarket element are likely to be discrete, as foodstuffs are<br />
not a commodity that is likely to be kept in a car for a long period of time. However, on the return<br />
journey to Bishopton it is possible that a number of trips may be made to the supermarket on the<br />
way home and as such it has been assumed that 30% of the trips will be pass by trips.<br />
4.25 Table 4.3 indicates the people trip generation associated with the 2,500 sqm GFA supermarket.<br />
The trip rates used have been obtained from an interrogation of the TRICS database as detailed<br />
before. The number of trips has been reduced to account for pass-by and linked trips.<br />
Table 4.3 Supermarket People Trip Generation<br />
AM Period PM Period<br />
In Out Total In Out Total<br />
Trip rate (per 100sqm) 5.92 3.74 9.66 11.70 11.52 23.22<br />
People Trips 148 94 242 293 288 581<br />
30% pass-by 44 28 72 88 86 174<br />
Internal People Trips 104 66 170 205 202 407