Traffic Assessment - Renfrewshire Council
Traffic Assessment - Renfrewshire Council
Traffic Assessment - Renfrewshire Council

Create successful ePaper yourself
Turn your PDF publications into a flip-book with our unique Google optimized e-Paper software.
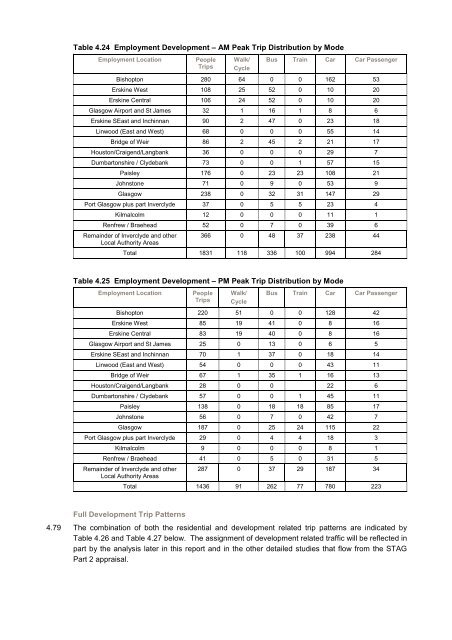
Table 4.24 Employment Development – AM Peak Trip Distribution by Mode<br />
Employment Location People<br />
Trips<br />
Walk/<br />
Cycle<br />
Bus Train Car Car Passenger<br />
Bishopton 280 64 0 0 162 53<br />
Erskine West 108 25 52 0 10 20<br />
Erskine Central 106 24 52 0 10 20<br />
Glasgow Airport and St James 32 1 16 1 8 6<br />
Erskine SEast and Inchinnan 90 2 47 0 23 18<br />
Linwood (East and West) 68 0 0 0 55 14<br />
Bridge of Weir 86 2 45 2 21 17<br />
Houston/Craigend/Langbank 36 0 0 0 29 7<br />
Dumbartonshire / Clydebank 73 0 0 1 57 15<br />
Paisley 176 0 23 23 108 21<br />
Johnstone 71 0 9 0 53 9<br />
Glasgow 238 0 32 31 147 29<br />
Port Glasgow plus part Inverclyde 37 0 5 5 23 4<br />
Kilmalcolm 12 0 0 0 11 1<br />
Renfrew / Braehead 52 0 7 0 39 6<br />
Remainder of Inverclyde and other<br />
Local Authority Areas<br />
366 0 48 37 238 44<br />
Total 1831 118 336 100 994 284<br />
Table 4.25 Employment Development – PM Peak Trip Distribution by Mode<br />
Employment Location People<br />
Trips<br />
Walk/<br />
Cycle<br />
Bus Train Car Car Passenger<br />
Bishopton 220 51 0 0 128 42<br />
Erskine West 85 19 41 0 8 16<br />
Erskine Central 83 19 40 0 8 16<br />
Glasgow Airport and St James 25 0 13 0 6 5<br />
Erskine SEast and Inchinnan 70 1 37 0 18 14<br />
Linwood (East and West) 54 0 0 0 43 11<br />
Bridge of Weir 67 1 35 1 16 13<br />
Houston/Craigend/Langbank 28 0 0 22 6<br />
Dumbartonshire / Clydebank 57 0 0 1 45 11<br />
Paisley 138 0 18 18 85 17<br />
Johnstone 56 0 7 0 42 7<br />
Glasgow 187 0 25 24 115 22<br />
Port Glasgow plus part Inverclyde 29 0 4 4 18 3<br />
Kilmalcolm 9 0 0 0 8 1<br />
Renfrew / Braehead 41 0 5 0 31 5<br />
Remainder of Inverclyde and other<br />
Local Authority Areas<br />
287 0 37 29 187 34<br />
Total 1436 91 262 77 780 223<br />
Full Development Trip Patterns<br />
4.79 The combination of both the residential and development related trip patterns are indicated by<br />
Table 4.26 and Table 4.27 below. The assignment of development related traffic will be reflected in<br />
part by the analysis later in this report and in the other detailed studies that flow from the STAG<br />
Part 2 appraisal.