Traffic Assessment - Renfrewshire Council
Traffic Assessment - Renfrewshire Council
Traffic Assessment - Renfrewshire Council

Create successful ePaper yourself
Turn your PDF publications into a flip-book with our unique Google optimized e-Paper software.
Secondary Education<br />
4.52 The secondary school trips from outwith the development site would potentially qualify for bus<br />
travel to and from the school. Assuming a bus occupancy figure of 50 pupils per bus would equate<br />
to a required provision of 8 buses to transport pupils to and from secondary school.<br />
Further Education<br />
4.53 As detailed in paragraph 4.16 further education student trips will be discounted. It is therefore<br />
necessary to establish the number of trips associated with students.<br />
4.54 By examining Table CAS218 in the National Census for the Bishopton ward it can be seen that<br />
there are 171 full time students in the 16 to 24 age group. Assuming that within this age group,<br />
students between 16 and 18 could still be at school. Consequently within the overall age band, two<br />
years can be discounted. To compensate for this, only 75% of the total will be considered giving a<br />
total of 128 students. Using the same principles for students who are also in employment a figure<br />
of a further 137 students is obtained. Additionally, there are another 69 older students which gives<br />
a student total of 334 students.<br />
4.55 As a percentage of the total population this equates to 11.2%. By applying this to the calculated<br />
trip rate, a trip rate for students can then be calculated and this equates to 296 trips in the AM and<br />
264 trips in the PM.<br />
External Trip Generation<br />
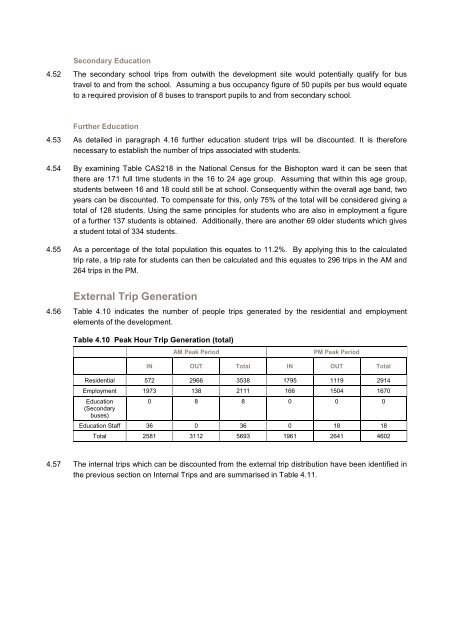
4.56 Table 4.10 indicates the number of people trips generated by the residential and employment<br />
elements of the development.<br />
Table 4.10 Peak Hour Trip Generation (total)<br />
AM Peak Period PM Peak Period<br />
IN OUT Total IN OUT Total<br />
Residential 572 2966 3538 1795 1119 2914<br />
Employment 1973 138 2111 166 1504 1670<br />
Education<br />
(Secondary<br />
buses)<br />
0 8 8 0 0 0<br />
Education Staff 36 0 36 0 18 18<br />
Total 2581 3112 5693 1961 2641 4602<br />
4.57 The internal trips which can be discounted from the external trip distribution have been identified in<br />
the previous section on Internal Trips and are summarised in Table 4.11.