Traffic Assessment - Renfrewshire Council
Traffic Assessment - Renfrewshire Council
Traffic Assessment - Renfrewshire Council

You also want an ePaper? Increase the reach of your titles
YUMPU automatically turns print PDFs into web optimized ePapers that Google loves.
Methodology for Residential Development<br />
4.65 The general methodology which has been applied is as follows:<br />
• People Trip Generation – Calculated using information from the TRICS database for residential<br />
related trips.<br />
• Residential Development People Trip Distribution – Distribution will generally follow existing<br />
patterns of Bishopton residents and the wider patterns in <strong>Renfrewshire</strong>. The existing trip<br />
distribution was obtained through analysis of 2001 census travel to work data. The patterns<br />
arising from above indicate high proportions of residents working within 5km of Bishopton. It is<br />
considered appropriate to continue with this pattern because firstly, there will be a significant<br />
number of new jobs in Bishopton, which will encourage synergy between the land uses and<br />
secondly, the trip generation relates to all trips, not just trips to work and hence a high degree<br />
of non work related trips will occur, for example taking children to school.<br />
• Residential Development People Trip Distribution – The distribution of trips within distance<br />
travelled bands has been undertaken using gravity model principles. For the residential<br />
development this process is based on the number of jobs within ward areas (these are taken<br />
from Annual Business Inquiry (ABI) 2001 (ABI) Statistics)<br />
• Residential Mode Share - The mode share used is that currently occurring in Bishopton again<br />
taken from the 2001 census data of Bishopton. The mode share is applied in bands of<br />
distance travelled to reflect local walking and at the other end of the scale the high proportion<br />
of car trips on longer distances. The impact of the train is also included. However, no<br />
adjustment has been made to account for the likely future upgrading of services on the<br />
Bishopton line (or on the rail network generally) during the implementation phases of the<br />
development which could increase the percentage of travel by train.<br />
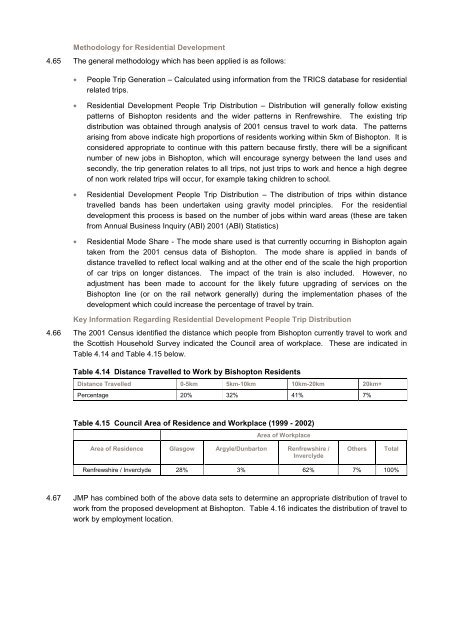
Key Information Regarding Residential Development People Trip Distribution<br />
4.66 The 2001 Census identified the distance which people from Bishopton currently travel to work and<br />
the Scottish Household Survey indicated the <strong>Council</strong> area of workplace. These are indicated in<br />
Table 4.14 and Table 4.15 below.<br />
Table 4.14 Distance Travelled to Work by Bishopton Residents<br />
Distance Travelled 0-5km 5km-10km 10km-20km 20km+<br />
Percentage 20% 32% 41% 7%<br />
Table 4.15 <strong>Council</strong> Area of Residence and Workplace (1999 - 2002)<br />
Area of Workplace<br />
Area of Residence Glasgow Argyle/Dunbarton <strong>Renfrewshire</strong> /<br />
Inverclyde<br />
Others Total<br />
<strong>Renfrewshire</strong> / Inverclyde 28% 3% 62% 7% 100%<br />
4.67 JMP has combined both of the above data sets to determine an appropriate distribution of travel to<br />
work from the proposed development at Bishopton. Table 4.16 indicates the distribution of travel to<br />
work by employment location.