Traffic Assessment - Renfrewshire Council
Traffic Assessment - Renfrewshire Council
Traffic Assessment - Renfrewshire Council

Create successful ePaper yourself
Turn your PDF publications into a flip-book with our unique Google optimized e-Paper software.
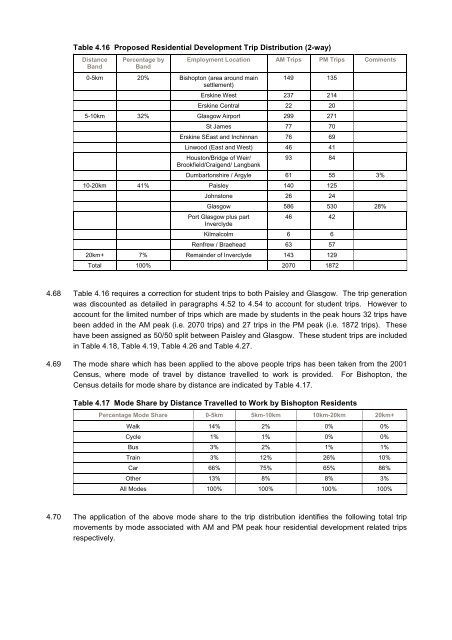
Table 4.16 Proposed Residential Development Trip Distribution (2-way)<br />
Distance<br />
Band<br />
Percentage by<br />
Band<br />
0-5km 20% Bishopton (area around main<br />
settlement)<br />
Employment Location AM Trips PM Trips Comments<br />
149 135<br />
Erskine West 237 214<br />
Erskine Central 22 20<br />
5-10km 32% Glasgow Airport 299 271<br />
St James 77 70<br />
Erskine SEast and Inchinnan 76 69<br />
Linwood (East and West) 46 41<br />
Houston/Bridge of Weir/<br />
Brookfield/Craigend/ Langbank<br />
93 84<br />
Dumbartonshire / Argyle 61 55 3%<br />
10-20km 41% Paisley 140 125<br />
Johnstone 26 24<br />
Glasgow 586 530 28%<br />
Port Glasgow plus part<br />
Inverclyde<br />
46 42<br />
Kilmalcolm 6 6<br />
Renfrew / Braehead 63 57<br />
20km+ 7% Remainder of Inverclyde 143 129<br />
Total 100% 2070 1872<br />
4.68 Table 4.16 requires a correction for student trips to both Paisley and Glasgow. The trip generation<br />
was discounted as detailed in paragraphs 4.52 to 4.54 to account for student trips. However to<br />
account for the limited number of trips which are made by students in the peak hours 32 trips have<br />
been added in the AM peak (i.e. 2070 trips) and 27 trips in the PM peak (i.e. 1872 trips). These<br />
have been assigned as 50/50 split between Paisley and Glasgow. These student trips are included<br />
in Table 4.18, Table 4.19, Table 4.26 and Table 4.27.<br />
4.69 The mode share which has been applied to the above people trips has been taken from the 2001<br />
Census, where mode of travel by distance travelled to work is provided. For Bishopton, the<br />
Census details for mode share by distance are indicated by Table 4.17.<br />
Table 4.17 Mode Share by Distance Travelled to Work by Bishopton Residents<br />
Percentage Mode Share 0-5km 5km-10km 10km-20km 20km+<br />
Walk 14% 2% 0% 0%<br />
Cycle 1% 1% 0% 0%<br />
Bus 3% 2% 1% 1%<br />
Train 3% 12% 26% 10%<br />
Car 66% 75% 65% 86%<br />
Other 13% 8% 8% 3%<br />
All Modes 100% 100% 100% 100%<br />
4.70 The application of the above mode share to the trip distribution identifies the following total trip<br />
movements by mode associated with AM and PM peak hour residential development related trips<br />
respectively.