Traffic Assessment - Renfrewshire Council
Traffic Assessment - Renfrewshire Council
Traffic Assessment - Renfrewshire Council

Create successful ePaper yourself
Turn your PDF publications into a flip-book with our unique Google optimized e-Paper software.
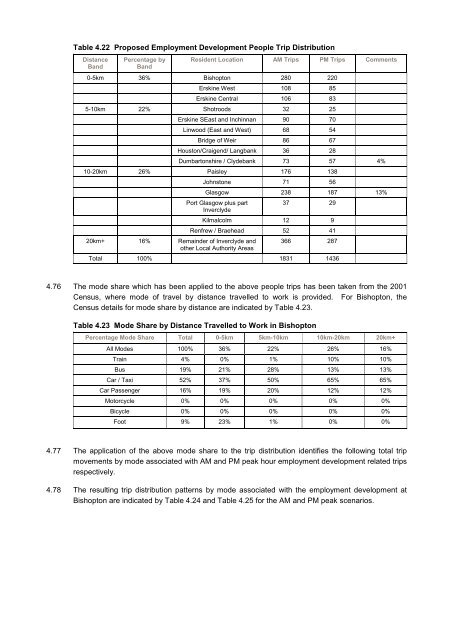
Table 4.22 Proposed Employment Development People Trip Distribution<br />
Distance<br />
Band<br />
Percentage by<br />
Band<br />
Resident Location AM Trips PM Trips Comments<br />
0-5km 36% Bishopton 280 220<br />
Erskine West 108 85<br />
Erskine Central 106 83<br />
5-10km 22% Shotroods 32 25<br />
Erskine SEast and Inchinnan 90 70<br />
Linwood (East and West) 68 54<br />
Bridge of Weir 86 67<br />
Houston/Craigend/ Langbank 36 28<br />
Dumbartonshire / Clydebank 73 57 4%<br />
10-20km 26% Paisley 176 138<br />
Johnstone 71 56<br />
Glasgow 238 187 13%<br />
Port Glasgow plus part<br />
Inverclyde<br />
20km+ 16% Remainder of Inverclyde and<br />
other Local Authority Areas<br />
37 29<br />
Kilmalcolm 12 9<br />
Renfrew / Braehead 52 41<br />
366 287<br />
Total 100% 1831 1436<br />
4.76 The mode share which has been applied to the above people trips has been taken from the 2001<br />
Census, where mode of travel by distance travelled to work is provided. For Bishopton, the<br />
Census details for mode share by distance are indicated by Table 4.23.<br />
Table 4.23 Mode Share by Distance Travelled to Work in Bishopton<br />
Percentage Mode Share Total 0-5km 5km-10km 10km-20km 20km+<br />
All Modes 100% 36% 22% 26% 16%<br />
Train 4% 0% 1% 10% 10%<br />
Bus 19% 21% 28% 13% 13%<br />
Car / Taxi 52% 37% 50% 65% 65%<br />
Car Passenger 16% 19% 20% 12% 12%<br />
Motorcycle 0% 0% 0% 0% 0%<br />
Bicycle 0% 0% 0% 0% 0%<br />
Foot 9% 23% 1% 0% 0%<br />
4.77 The application of the above mode share to the trip distribution identifies the following total trip<br />
movements by mode associated with AM and PM peak hour employment development related trips<br />
respectively.<br />
4.78 The resulting trip distribution patterns by mode associated with the employment development at<br />
Bishopton are indicated by Table 4.24 and Table 4.25 for the AM and PM peak scenarios.