School Plan - Blytheville Public Schools
School Plan - Blytheville Public Schools
School Plan - Blytheville Public Schools

You also want an ePaper? Increase the reach of your titles
YUMPU automatically turns print PDFs into web optimized ePapers that Google loves.
ACSIP http://acsip.state.ar.us/cgi-bin/index.cgi?rm=report_acsip<br />
6.<br />
7.<br />
8.<br />
9.<br />
10.<br />
11.<br />
12.<br />
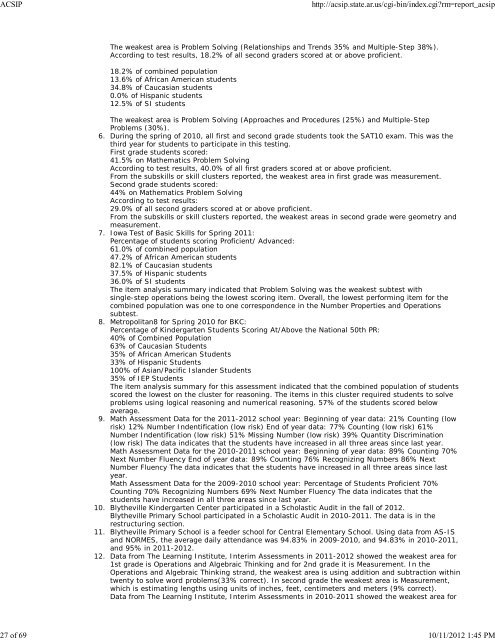
The weakest area is Problem Solving (Relationships and Trends 35% and Multiple-Step 38%).<br />
According to test results, 18.2% of all second graders scored at or above proficient.<br />
18.2% of combined population<br />
13.6% of African American students<br />
34.8% of Caucasian students<br />
0.0% of Hispanic students<br />
12.5% of SI students<br />
The weakest area is Problem Solving (Approaches and Procedures (25%) and Multiple-Step<br />
Problems (30%).<br />
During the spring of 2010, all first and second grade students took the SAT10 exam. This was the<br />
third year for students to participate in this testing.<br />
First grade students scored:<br />
41.5% on Mathematics Problem Solving<br />
According to test results, 40.0% of all first graders scored at or above proficient.<br />
From the subskills or skill clusters reported, the weakest area in first grade was measurement.<br />
Second grade students scored:<br />
44% on Mathematics Problem Solving<br />
According to test results:<br />
29.0% of all second graders scored at or above proficient.<br />
From the subskills or skill clusters reported, the weakest areas in second grade were geometry and<br />
measurement.<br />
Iowa Test of Basic Skills for Spring 2011:<br />
Percentage of students scoring Proficient/ Advanced:<br />
61.0% of combined population<br />
47.2% of African American students<br />
82.1% of Caucasian students<br />
37.5% of Hispanic students<br />
36.0% of SI students<br />
The item analysis summary indicated that Problem Solving was the weakest subtest with<br />
single-step operations being the lowest scoring item. Overall, the lowest performing item for the<br />
combined population was one to one correspondence in the Number Properties and Operations<br />
subtest.<br />
Metropolitan8 for Spring 2010 for BKC:<br />
Percentage of Kindergarten Students Scoring At/Above the National 50th PR:<br />
40% of Combined Population<br />
63% of Caucasian Students<br />
35% of African American Students<br />
33% of Hispanic Students<br />
100% of Asian/Pacific Islander Students<br />
35% of IEP Students<br />
The item analysis summary for this assessment indicated that the combined population of students<br />
scored the lowest on the cluster for reasoning. The items in this cluster required students to solve<br />
problems using logical reasoning and numerical reasoning. 57% of the students scored below<br />
average.<br />
Math Assessment Data for the 2011-2012 school year: Beginning of year data: 21% Counting (low<br />
risk) 12% Number Indentification (low risk) End of year data: 77% Counting (low risk) 61%<br />
Number Indentification (low risk) 51% Missing Number (low risk) 39% Quantity Discrimination<br />
(low risk) The data indicates that the students have increased in all three areas since last year.<br />
Math Assessment Data for the 2010-2011 school year: Beginning of year data: 89% Counting 70%<br />
Next Number Fluency End of year data: 89% Counting 76% Recognizing Numbers 86% Next<br />
Number Fluency The data indicates that the students have increased in all three areas since last<br />
year.<br />
Math Assessment Data for the 2009-2010 school year: Percentage of Students Proficient 70%<br />
Counting 70% Recognizing Numbers 69% Next Number Fluency The data indicates that the<br />
students have increased in all three areas since last year.<br />
<strong>Blytheville</strong> Kindergarten Center participated in a Scholastic Audit in the fall of 2012.<br />
<strong>Blytheville</strong> Primary <strong>School</strong> participated in a Scholastic Audit in 2010-2011. The data is in the<br />
restructuring section.<br />
<strong>Blytheville</strong> Primary <strong>School</strong> is a feeder school for Central Elementary <strong>School</strong>. Using data from AS-IS<br />
and NORMES, the average daily attendance was 94.83% in 2009-2010, and 94.83% in 2010-2011,<br />
and 95% in 2011-2012.<br />
Data from The Learning Institute, Interim Assessments in 2011-2012 showed the weakest area for<br />
1st grade is Operations and Algebraic Thinking and for 2nd grade it is Measurement. In the<br />
Operations and Algebraic Thinking strand, the weakest area is using addition and subtraction within<br />
twenty to solve word problems(33% correct). In second grade the weakest area is Measurement,<br />
which is estimating lengths using units of inches, feet, centimeters and meters (9% correct).<br />
Data from The Learning Institute, Interim Assessments in 2010-2011 showed the weakest area for<br />
27 of 69 10/11/2012 1:45 PM