School Plan - Blytheville Public Schools
School Plan - Blytheville Public Schools
School Plan - Blytheville Public Schools

You also want an ePaper? Increase the reach of your titles
YUMPU automatically turns print PDFs into web optimized ePapers that Google loves.
ACSIP http://acsip.state.ar.us/cgi-bin/index.cgi?rm=report_acsip<br />
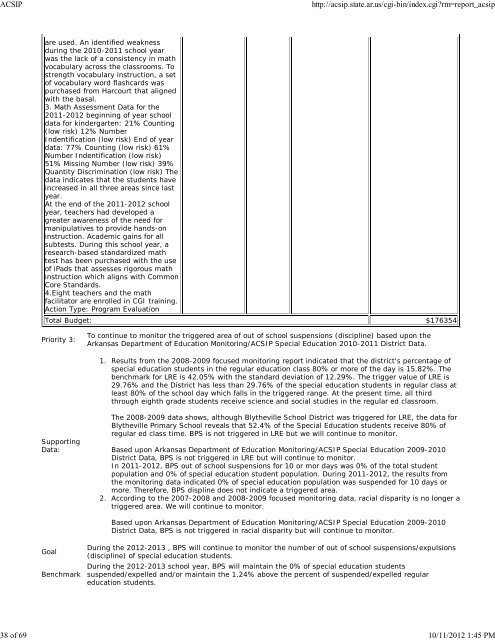
are used. An identified weakness<br />
during the 2010-2011 school year<br />
was the lack of a consistency in math<br />
vocabulary across the classrooms. To<br />
strength vocabulary instruction, a set<br />
of vocabulary word flashcards was<br />
purchased from Harcourt that aligned<br />
with the basal.<br />
3. Math Assessment Data for the<br />
2011-2012 beginning of year school<br />
data for kindergarten: 21% Counting<br />
(low risk) 12% Number<br />
Indentification (low risk) End of year<br />
data: 77% Counting (low risk) 61%<br />
Number Indentification (low risk)<br />
51% Missing Number (low risk) 39%<br />
Quantity Discrimination (low risk) The<br />
data indicates that the students have<br />
increased in all three areas since last<br />
year.<br />
At the end of the 2011-2012 school<br />
year, teachers had developed a<br />
greater awareness of the need for<br />
manipulatives to provide hands-on<br />
instruction. Academic gains for all<br />
subtests. During this school year, a<br />
research-based standardized math<br />
test has been purchased with the use<br />
of iPads that assesses rigorous math<br />
instruction which aligns with Common<br />
Core Standards.<br />
4.Eight teachers and the math<br />
facilitator are enrolled in CGI training.<br />
Action Type: Program Evaluation<br />
Total Budget: $176354<br />
Priority 3:<br />
Supporting<br />
Data:<br />
Goal<br />
Benchmark<br />
To continue to monitor the triggered area of out of school suspensions (discipline) based upon the<br />
Arkansas Department of Education Monitoring/ACSIP Special Education 2010-2011 District Data.<br />
1.<br />
2.<br />
Results from the 2008-2009 focused monitoring report indicated that the district's percentage of<br />
special education students in the regular education class 80% or more of the day is 15.82%. The<br />
benchmark for LRE is 42.05% with the standard deviation of 12.29%. The trigger value of LRE is<br />
29.76% and the District has less than 29.76% of the special education students in regular class at<br />
least 80% of the school day which falls in the triggered range. At the present time, all third<br />
through eighth grade students receive science and social studies in the regular ed classroom.<br />
The 2008-2009 data shows, although <strong>Blytheville</strong> <strong>School</strong> District was triggered for LRE, the data for<br />
<strong>Blytheville</strong> Primary <strong>School</strong> reveals that 52.4% of the Special Education students receive 80% of<br />
regular ed class time. BPS is not triggered in LRE but we will continue to monitor.<br />
Based upon Arkansas Department of Education Monitoring/ACSIP Special Education 2009-2010<br />
District Data, BPS is not triggered in LRE but will continue to monitor.<br />
In 2011-2012, BPS out of school suspensions for 10 or mor days was 0% of the total student<br />
population and 0% of special education student population. During 2011-2012, the results from<br />
the monitoring data indicated 0% of special education population was suspended for 10 days or<br />
more. Therefore, BPS displine does not indicate a triggered area.<br />
According to the 2007-2008 and 2008-2009 focused monitoring data, racial disparity is no longer a<br />
triggered area. We will continue to monitor.<br />
Based upon Arkansas Department of Education Monitoring/ACSIP Special Education 2009-2010<br />
District Data, BPS is not triggered in racial disparity but will continue to monitor.<br />
During the 2012-2013 , BPS will continue to monitor the number of out of school suspensions/expulsions<br />
(discipline) of special education students.<br />
During the 2012-2013 school year, BPS will maintain the 0% of special education students<br />
suspended/expelled and/or maintain the 1.24% above the percent of suspended/expelled regular<br />
education students.<br />
38 of 69 10/11/2012 1:45 PM