School Plan - Blytheville Public Schools
School Plan - Blytheville Public Schools
School Plan - Blytheville Public Schools
Create successful ePaper yourself
Turn your PDF publications into a flip-book with our unique Google optimized e-Paper software.
ACSIP http://acsip.state.ar.us/cgi-bin/index.cgi?rm=report_acsip<br />
7.<br />
8.<br />
9.<br />
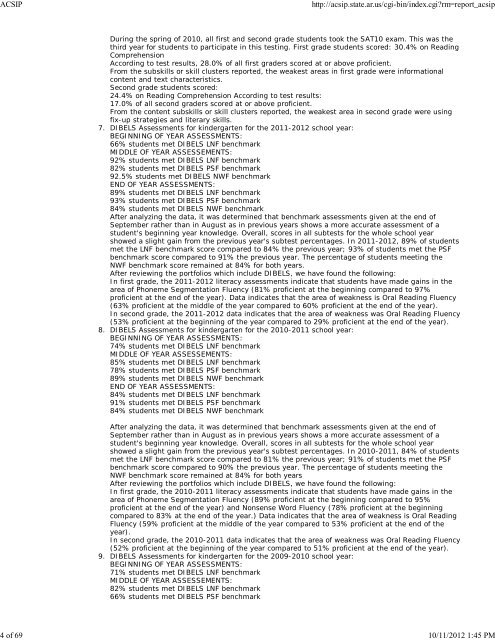
During the spring of 2010, all first and second grade students took the SAT10 exam. This was the<br />
third year for students to participate in this testing. First grade students scored: 30.4% on Reading<br />
Comprehension<br />
According to test results, 28.0% of all first graders scored at or above proficient.<br />
From the subskills or skill clusters reported, the weakest areas in first grade were informational<br />
content and text characteristics.<br />
Second grade students scored:<br />
24.4% on Reading Comprehension According to test results:<br />
17.0% of all second graders scored at or above proficient.<br />
From the content subskills or skill clusters reported, the weakest area in second grade were using<br />
fix-up strategies and literary skills.<br />
DIBELS Assessments for kindergarten for the 2011-2012 school year:<br />
BEGINNING OF YEAR ASSESSMENTS:<br />
66% students met DIBELS LNF benchmark<br />
MIDDLE OF YEAR ASSESSEMENTS:<br />
92% students met DIBELS LNF benchmark<br />
82% students met DIBELS PSF benchmark<br />
92.5% students met DIBELS NWF benchmark<br />
END OF YEAR ASSESSMENTS:<br />
89% students met DIBELS LNF benchmark<br />
93% students met DIBELS PSF benchmark<br />
84% students met DIBELS NWF benchmark<br />
After analyzing the data, it was determined that benchmark assessments given at the end of<br />
September rather than in August as in previous years shows a more accurate assessment of a<br />
student's beginning year knowledge. Overall, scores in all subtests for the whole school year<br />
showed a slight gain from the previous year's subtest percentages. In 2011-2012, 89% of students<br />
met the LNF benchmark score compared to 84% the previous year; 93% of students met the PSF<br />
benchmark score compared to 91% the previous year. The percentage of students meeting the<br />
NWF benchmark score remained at 84% for both years.<br />
After reviewing the portfolios which include DIBELS, we have found the following:<br />
In first grade, the 2011-2012 literacy assessments indicate that students have made gains in the<br />
area of Phoneme Segmentation Fluency (81% proficient at the beginning compared to 97%<br />
proficient at the end of the year). Data indicates that the area of weakness is Oral Reading Fluency<br />
(63% proficient at the middle of the year compared to 60% proficient at the end of the year).<br />
In second grade, the 2011-2012 data indicates that the area of weakness was Oral Reading Fluency<br />
(53% proficient at the beginning of the year compared to 29% proficient at the end of the year).<br />
DIBELS Assessments for kindergarten for the 2010-2011 school year:<br />
BEGINNING OF YEAR ASSESSMENTS:<br />
74% students met DIBELS LNF benchmark<br />
MIDDLE OF YEAR ASSESSEMENTS:<br />
85% students met DIBELS LNF benchmark<br />
78% students met DIBELS PSF benchmark<br />
89% students met DIBELS NWF benchmark<br />
END OF YEAR ASSESSMENTS:<br />
84% students met DIBELS LNF benchmark<br />
91% students met DIBELS PSF benchmark<br />
84% students met DIBELS NWF benchmark<br />
After analyzing the data, it was determined that benchmark assessments given at the end of<br />
September rather than in August as in previous years shows a more accurate assessment of a<br />
student's beginning year knowledge. Overall, scores in all subtests for the whole school year<br />
showed a slight gain from the previous year's subtest percentages. In 2010-2011, 84% of students<br />
met the LNF benchmark score compared to 81% the previous year; 91% of students met the PSF<br />
benchmark score compared to 90% the previous year. The percentage of students meeting the<br />
NWF benchmark score remained at 84% for both years<br />
After reviewing the portfolios which include DIBELS, we have found the following:<br />
In first grade, the 2010-2011 literacy assessments indicate that students have made gains in the<br />
area of Phoneme Segmentation Fluency (89% proficient at the beginning compared to 95%<br />
proficient at the end of the year) and Nonsense Word Fluency (78% proficient at the beginning<br />
compared to 83% at the end of the year.) Data indicates that the area of weakness is Oral Reading<br />
Fluency (59% proficient at the middle of the year compared to 53% proficient at the end of the<br />
year).<br />
In second grade, the 2010-2011 data indicates that the area of weakness was Oral Reading Fluency<br />
(52% proficient at the beginning of the year compared to 51% proficient at the end of the year).<br />
DIBELS Assessments for kindergarten for the 2009-2010 school year:<br />
BEGINNING OF YEAR ASSESSMENTS:<br />
71% students met DIBELS LNF benchmark<br />
MIDDLE OF YEAR ASSESSEMENTS:<br />
82% students met DIBELS LNF benchmark<br />
66% students met DIBELS PSF benchmark<br />
4 of 69 10/11/2012 1:45 PM


