

Baltic Sea
Baltic Sea
Baltic Sea

Create successful ePaper yourself
Turn your PDF publications into a flip-book with our unique Google optimized e-Paper software.
4<br />
3<br />
2<br />
SLP (VPSA)<br />
38<br />
80<br />
60<br />
40<br />
1<br />
0<br />
1<br />
2<br />
3<br />
SL ∆(VP−SA) (cm)<br />
20<br />
0<br />
−20<br />
−40<br />
−60<br />
4<br />
30/09 10/10 20/10 30/10 09/11 19/11 29/11 09/12 19/12<br />
Date in 2006 (dd/mm)<br />
A<br />
−80<br />
−15 −10 −5 0 5 10 15<br />
38 (m/s)<br />
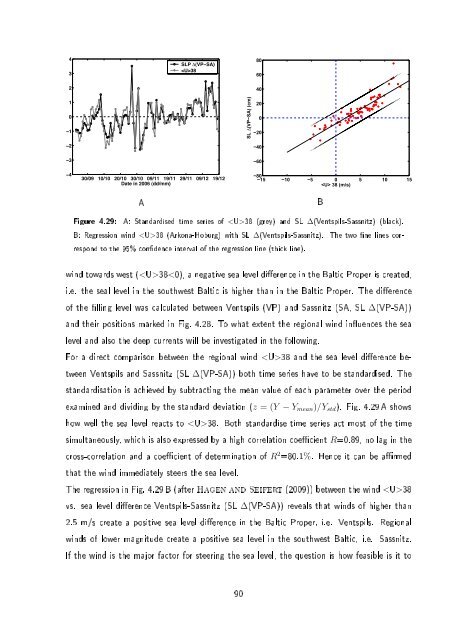
Figure 4.29: A: Standardised time series of 38 (grey) and SL ∆(Ventspils-Sassnitz) (black).<br />
B: Regression wind 38 (Arkona-Hoburg) with SL ∆(Ventspils-Sassnitz). The two ne lines correspond<br />
to the 95% condence interval of the regression line (thick line).<br />
B<br />
wind towards west (38
