

Baltic Sea
Baltic Sea
Baltic Sea

You also want an ePaper? Increase the reach of your titles
YUMPU automatically turns print PDFs into web optimized ePapers that Google loves.
Volume (km 3 )<br />
2.5<br />
2<br />
1.5<br />
1<br />
0.5<br />
0<br />
−0.5<br />
−1<br />
−1.5<br />
−2<br />
−2.5<br />
x 10 4<br />
Cumulative volume through Stolpe Channel −<br />
5−day means<br />
pos and neg<br />
pos<br />
neg<br />
11/10/02 23/02/04 07/07/05 19/11/06 02/04/08 15/08/09<br />
Date (dd/mm/yy)<br />
(a) 2002 −2009<br />
Volume (km 3 )<br />
4000<br />
3000<br />
2000<br />
1000<br />
0<br />
−1000<br />
−2000<br />
−3000<br />
Cumulative volume through Stolpe Channel −<br />
5−day means<br />
pos and neg<br />
pos<br />
neg<br />
−4000<br />
03/05/06 22/06/06 11/08/06 30/09/06 19/11/06 08/01/07 27/02/07 18/04/07<br />
Date (dd/mm/yy)<br />
(b) May 2006 −March 2007<br />
1500<br />
1000<br />
Cumulative volume through Stolpe Channel −<br />
5−day means<br />
pos and neg<br />
pos<br />
neg<br />
Volume (km 3 )<br />
500<br />
0<br />
−500<br />
−1000<br />
−1500<br />
20/09 30/09 10/10 20/10 30/10 09/11 19/11 29/11 09/12 19/12 29/12<br />
Date in 2006 (dd/mm)<br />
(c) September to December 2006<br />
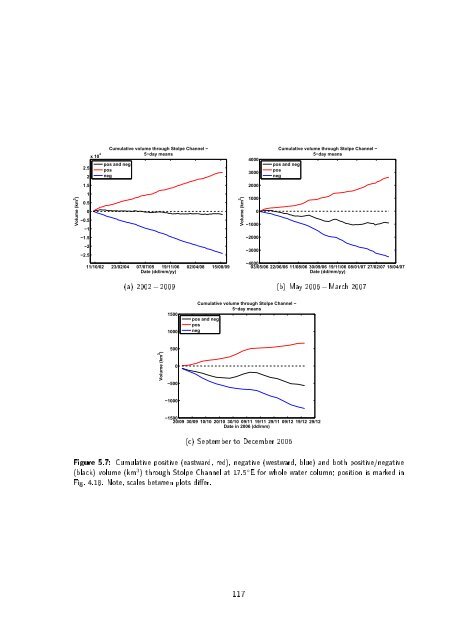
Figure 5.7: Cumulative positive (eastward, red), negative (westward, blue) and both positive/negative<br />
(black) volume (km 3 ) through Stolpe Channel at 17.5 ◦ E for whole water column; position is marked in<br />
Fig. 4.18. Note, scales between plots dier.<br />
117
