

Baltic Sea
Baltic Sea
Baltic Sea

Create successful ePaper yourself
Turn your PDF publications into a flip-book with our unique Google optimized e-Paper software.
160<br />
170<br />
180<br />
Volume of EGB below 170m<br />
regression from CTD data<br />
regression from model data<br />
model bathymetry<br />
190<br />
Depth (m)<br />
200<br />
210<br />
220<br />
230<br />
240<br />
250<br />
0 10 20 30 40 50 60 70 80 90<br />
Volume (km 3 )<br />
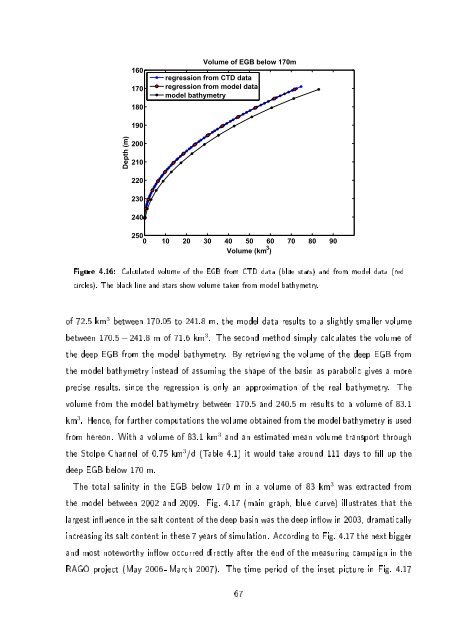
Figure 4.16: Calculated volume of the EGB from CTD data (blue stars) and from model data (red<br />
circles). The black line and stars show volume taken from model bathymetry.<br />
of 72.5 km 3 between 170.05 to 241.8 m, the model data results to a slightly smaller volume<br />
between 170.5 − 241.8 m of 71.6 km 3 . The second method simply calculates the volume of<br />
the deep EGB from the model bathymetry. By retrieving the volume of the deep EGB from<br />
the model bathymetry instead of assuming the shape of the basin as parabolic gives a more<br />
precise results, since the regression is only an approximation of the real bathymetry. The<br />
volume from the model bathymetry between 170.5 and 240.5 m results to a volume of 83.1<br />
km 3 . Hence, for further computations the volume obtained from the model bathymetry is used<br />
from hereon. With a volume of 83.1 km 3 and an estimated mean volume transport through<br />
the Stolpe Channel of 0.75 km 3 /d (Table 4.1) it would take around 111 days to ll up the<br />
deep EGB below 170 m.<br />
The total salinity in the EGB below 170 m in a volume of 83 km 3 was extracted from<br />
the model between 2002 and 2009. Fig. 4.17 (main graph, blue curve) illustrates that the<br />
largest inuence in the salt content of the deep basin was the deep inow in 2003, dramatically<br />
increasing its salt content in these 7 years of simulation. According to Fig. 4.17 the next bigger<br />
and most noteworthy inow occurred directly after the end of the measuring campaign in the<br />
RAGO project (May 2006 - March 2007). The time period of the inset picture in Fig. 4.17<br />
67
