

Baltic Sea
Baltic Sea
Baltic Sea

Create successful ePaper yourself
Turn your PDF publications into a flip-book with our unique Google optimized e-Paper software.
190<br />
a<br />
200<br />
Depth (m)<br />
210<br />
220<br />
230<br />
240<br />
6.5 6.6 6.7 6.8 6.9 7 7.1 7.2 7.3<br />
pot. Temperature ( o C)<br />
17.02.98 18:07<br />
17.02.98 20:49<br />
190<br />
200<br />
18.02.98 7:09<br />
17.2.98 mean prof.<br />
27.03.98 1:20<br />
21.4.98 14:57<br />
b<br />
Depth (m)<br />
210<br />
220<br />
230<br />
240<br />
12.25 12.3 12.35 12.4 12.45 12.5 12.55 12.6 12.65 12.7<br />
Salinity (g/kg)<br />
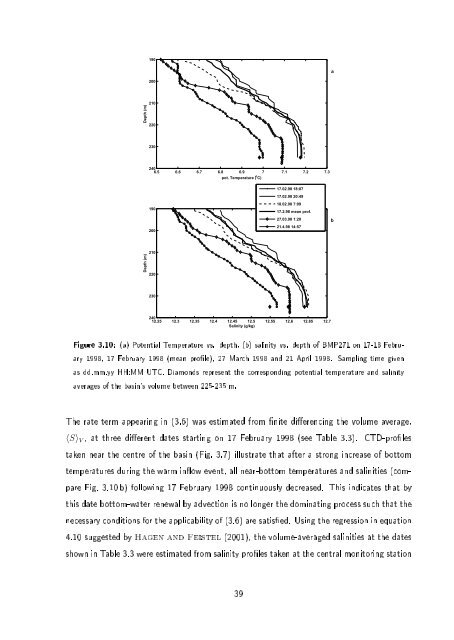
Figure 3.10: (a) Potential Temperature vs. depth, (b) salinity vs. depth of BMP271 on 17-18 February<br />
1998, 17 February 1998 (mean prole), 27 March 1998 and 21 April 1998. Sampling time given<br />
as dd.mm.yy HH:MM UTC. Diamonds represent the corresponding potential temperature and salinity<br />
averages of the basin's volume between 225-235 m.<br />
The rate term appearing in (3.6) was estimated from nite dierencing the volume average,<br />
〈S〉 V , at three dierent dates starting on 17 February 1998 (see Table 3.3). CTD-proles<br />
taken near the centre of the basin (Fig. 3.7) illustrate that after a strong increase of bottom<br />
temperatures during the warm inow event, all near-bottom temperatures and salinities (compare<br />
Fig. 3.10 b) following 17 February 1998 continuously decreased. This indicates that by<br />
this date bottom-water renewal by advection is no longer the dominating process such that the<br />
necessary conditions for the applicability of (3.6) are satised. Using the regression in equation<br />
4.10 suggested by Hagen and Feistel (2001), the volume-averaged salinities at the dates<br />
shown in Table 3.3 were estimated from salinity proles taken at the central monitoring station<br />
39
