

Baltic Sea
Baltic Sea
Baltic Sea

Create successful ePaper yourself
Turn your PDF publications into a flip-book with our unique Google optimized e-Paper software.
Potential Temperature ( o C)<br />
8<br />
7<br />
6<br />
5<br />
4<br />
3<br />
2<br />
5.6<br />
6<br />
6.4<br />
6.8<br />
7.2<br />
7.6<br />
8<br />
8.4<br />
8.8<br />
9.2<br />
9.69.6<br />
9.2<br />
8.8<br />
8.4<br />
8<br />
7.6<br />
7.2<br />
6.8<br />
6.4<br />
6<br />
5.6<br />
10<br />
10.4<br />
10.8<br />
10<br />
10.4<br />
10.8<br />
1<br />
7 8 9 10 11 12 13 14<br />
Salinity (g/kg)<br />
Potential Temperature ( o C)<br />
8<br />
7<br />
6<br />
5<br />
4<br />
3<br />
2<br />
5.6<br />
6<br />
6.4<br />
6.8<br />
7.2<br />
7.6<br />
8<br />
8.4<br />
8.8<br />
8.8<br />
8.4<br />
8<br />
7.6<br />
7.2<br />
6.8<br />
6.4<br />
6<br />
5.6<br />
9.29.2<br />
9.69.6<br />
10<br />
10.410.4<br />
10.8<br />
10<br />
10.8<br />
1<br />
7 8 9 10 11 12 13 14<br />
Salinity (g/kg)<br />
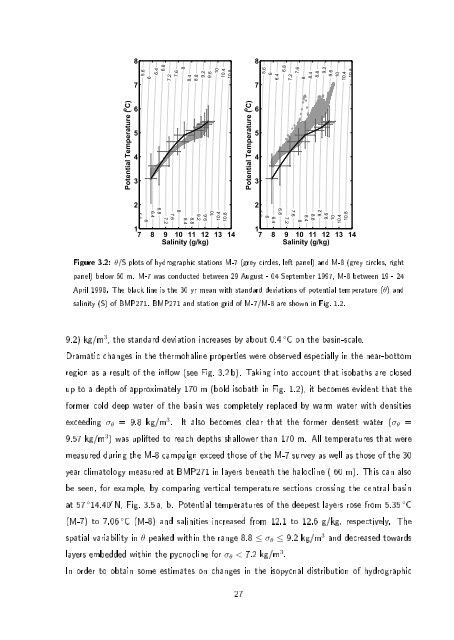
Figure 3.2: θ/S plots of hydrographic stations M-7 (grey circles, left panel) and M-8 (grey circles, right<br />
panel) below 60 m. M-7 was conducted between 29 August - 04 September 1997, M-8 between 19 - 24<br />
April 1998. The black line is the 30 yr mean with standard deviations of potential temperature (θ) and<br />
salinity (S) of BMP271. BMP271 and station grid of M-7/M-8 are shown in Fig. 1.2.<br />
9.2) kg/m 3 , the standard deviation increases by about 0.4 ◦ C on the basin-scale.<br />
Dramatic changes in the thermohaline properties were observed especially in the near-bottom<br />
region as a result of the inow (see Fig. 3.2 b). Taking into account that isobaths are closed<br />
up to a depth of approximately 170 m (bold isobath in Fig. 1.2), it becomes evident that the<br />
former cold deep water of the basin was completely replaced by warm water with densities<br />
exceeding σ θ = 9.8 kg/m 3 . It also becomes clear that the former densest water (σ θ =<br />
9.57 kg/m 3 ) was uplifted to reach depths shallower than 170 m. All temperatures that were<br />
measured during the M-8 campaign exceed those of the M-7 survey as well as those of the 30<br />
year climatology measured at BMP271 in layers beneath the halocline ( 60 m). This can also<br />
be seen, for example, by comparing vertical temperature sections crossing the central basin<br />
at 57 ◦ 14.40 ′ N, Fig. 3.5 a, b. Potential temperatures of the deepest layers rose from 5.35 ◦ C<br />
(M-7) to 7.06 ◦ C (M-8) and salinities increased from 12.1 to 12.6 g/kg, respectively. The<br />
spatial variability in θ peaked within the range 8.8 ≤ σ θ ≤ 9.2 kg/m 3 and decreased towards<br />
layers embedded within the pycnocline for σ θ < 7.2 kg/m 3 .<br />
In order to obtain some estimates on changes in the isopycnal distribution of hydrographic<br />
27
