

Baltic Sea
Baltic Sea
Baltic Sea

Create successful ePaper yourself
Turn your PDF publications into a flip-book with our unique Google optimized e-Paper software.
For this reason, the displayed temperature values in Fig. 4.5 exhibit a shorter time period<br />
than the two other moorings SE and SW. Having said that the inow entered the basin in<br />
intermediate layers in September 2006 and as a result large parts of it were also captured by<br />
the NE mooring.<br />
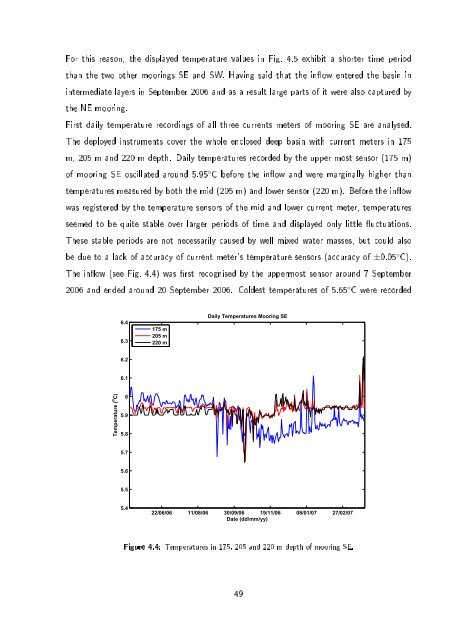
First daily temperature recordings of all three currents meters of mooring SE are analysed.<br />
The deployed instruments cover the whole enclosed deep basin with current meters in 175<br />
m, 205 m and 220 m depth. Daily temperatures recorded by the upper most sensor (175 m)<br />
of mooring SE oscillated around 5.95 ◦ C before the inow and were marginally higher than<br />
temperatures measured by both the mid (205 m) and lower sensor (220 m). Before the inow<br />
was registered by the temperature sensors of the mid and lower current meter, temperatures<br />
seemed to be quite stable over larger periods of time and displayed only little uctuations.<br />
These stable periods are not necessarily caused by well mixed water masses, but could also<br />
be due to a lack of accuracy of current meter's temperature sensors (accuracy of ±0.05 ◦ C).<br />
The inow (see Fig. 4.4) was rst recognised by the uppermost sensor around 7 September<br />
2006 and ended around 20 September 2006. Coldest temperatures of 5.65 ◦ C were recorded<br />
6.4<br />
6.3<br />
175 m<br />
205 m<br />
220 m<br />
Daily Temperatures Mooring SE<br />
6.2<br />
6.1<br />
Temperature ( o C)<br />
6<br />
5.9<br />
5.8<br />
5.7<br />
5.6<br />
5.5<br />
5.4<br />
22/06/06 11/08/06 30/09/06 19/11/06 08/01/07 27/02/07<br />
Date (dd/mm/yy)<br />
Figure 4.4: Temperatures in 175, 205 and 220 m depth of mooring SE.<br />
49
