

Baltic Sea
Baltic Sea
Baltic Sea

You also want an ePaper? Increase the reach of your titles
YUMPU automatically turns print PDFs into web optimized ePapers that Google loves.
needs some explanation, since the lag between measured transports and the salt content of<br />
the EGB have only a lag of 15 days, which corresponds with the second peak and same lag<br />
between VoltrpSF ADCP and the salt content of the EGB. The 20 day lag could be caused by<br />
water masses which leave the Stolpe Channel towards the deepest pathway but are split and<br />
take a detour through the western part of the Gdansk Basin rst. The third peak of no lag<br />
could be the result of internal seiches, which have a period of 2 days (Samuelsson and<br />
Stigebrandt, 1996).<br />
Cumulative Volume through Stolpe Channel −<br />
5−day means of salinity > 12 g/kg<br />
Cumulative Volume through Stolpe Channel −<br />
5−day means of salinity > 12 g/kg<br />
Volume (km 3 )<br />
3500<br />
3000<br />
2500<br />
2000<br />
1500<br />
1000<br />
pos and neg<br />
pos<br />
neg<br />
Volume (km 3 )<br />
500<br />
400<br />
300<br />
200<br />
100<br />
pos and neg<br />
pos<br />
neg<br />
500<br />
0<br />
−500<br />
0<br />
−100<br />
29/05/01 11/10/02 23/02/04 07/07/05 19/11/06 02/04/08<br />
Date (dd/mm/yy)<br />
(a) 2002 −2009<br />
03/05/06 22/06/06 11/08/06 30/09/06 19/11/06 08/01/07<br />
Date (dd/mm/yy)<br />
(b) May 2006 −March 2007<br />
120<br />
100<br />
Cumulative Volume through Stolpe Channel −<br />
5−day means of salinity > 12 g/kg<br />
pos and neg<br />
pos<br />
neg<br />
80<br />
Volume (km 3 )<br />
60<br />
40<br />
20<br />
0<br />
−20<br />
20/09 30/09 10/10 20/10 30/10 09/11 19/11 29/11 09/12 19/12 29/12<br />
Date in 2006 (dd/mm)<br />
(c) September to December 2006<br />
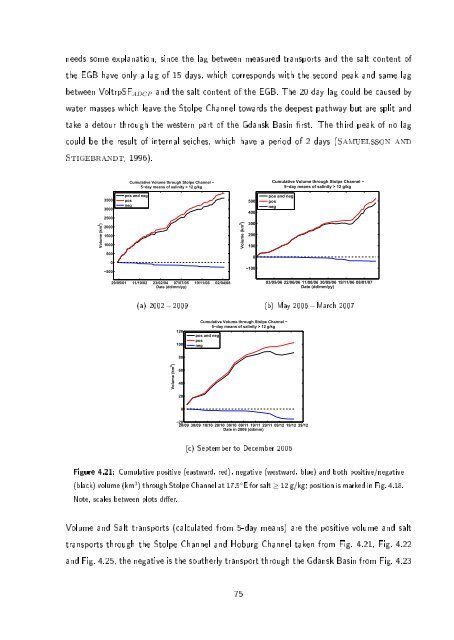
Figure 4.21: Cumulative positive (eastward, red), negative (westward, blue) and both positive/negative<br />
(black) volume (km 3 ) through Stolpe Channel at 17.5 ◦ E for salt ≥ 12 g/kg; position is marked in Fig. 4.18.<br />
Note, scales between plots dier.<br />
Volume and Salt transports (calculated from 5-day means) are the positive volume and salt<br />
transports through the Stolpe Channel and Hoburg Channel taken from Fig. 4.21, Fig. 4.22<br />
and Fig. 4.25, the negative is the southerly transport through the Gdansk Basin from Fig. 4.23<br />
75
