

Baltic Sea
Baltic Sea
Baltic Sea

Create successful ePaper yourself
Turn your PDF publications into a flip-book with our unique Google optimized e-Paper software.
6.4<br />
6.3<br />
178 m<br />
208 m<br />
223 m<br />
Daily Temperatures Mooring NE<br />
6.2<br />
6.1<br />
Temperature ( o C)<br />
6<br />
5.9<br />
5.8<br />
5.7<br />
5.6<br />
5.5<br />
5.4<br />
10/10/06 30/10/06 19/11/06 09/12/06 29/12/06 18/01/07 07/02/07 27/02/07 19/03/07<br />
Date (dd/mm/yy)<br />
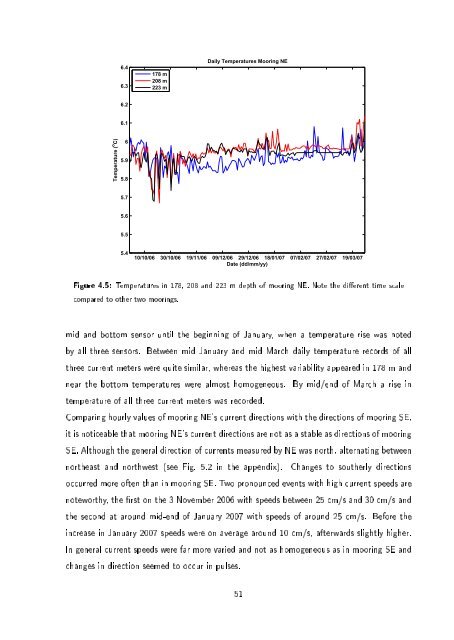
Figure 4.5: Temperatures in 178, 208 and 223 m depth of mooring NE. Note the dierent time scale<br />
compared to other two moorings.<br />
mid and bottom sensor until the beginning of January, when a temperature rise was noted<br />
by all three sensors. Between mid January and mid March daily temperature records of all<br />
three current meters were quite similar, whereas the highest variability appeared in 178 m and<br />
near the bottom temperatures were almost homogeneous. By mid/end of March a rise in<br />
temperature of all three current meters was recorded.<br />
Comparing hourly values of mooring NE's current directions with the directions of mooring SE,<br />
it is noticeable that mooring NE's current directions are not as a stable as directions of mooring<br />
SE. Although the general direction of currents measured by NE was north, alternating between<br />
northeast and northwest (see Fig. 5.2 in the appendix). Changes to southerly directions<br />
occurred more often than in mooring SE. Two pronounced events with high current speeds are<br />
noteworthy, the rst on the 3 November 2006 with speeds between 25 cm/s and 30 cm/s and<br />
the second at around mid-end of January 2007 with speeds of around 25 cm/s. Before the<br />
increase in January 2007 speeds were on average around 10 cm/s, afterwards slightly higher.<br />
In general current speeds were far more varied and not as homogeneous as in mooring SE and<br />
changes in direction seemed to occur in pulses.<br />
51
