

Baltic Sea
Baltic Sea
Baltic Sea

Create successful ePaper yourself
Turn your PDF publications into a flip-book with our unique Google optimized e-Paper software.
θ ( o C)<br />
S<br />
Depth (m)<br />
50<br />
100<br />
150<br />
200<br />
SW<br />
3<br />
2.5<br />
5.8<br />
6 5.8<br />
5.8<br />
16<br />
6<br />
6.2<br />
3<br />
5.4<br />
6.2<br />
6<br />
6<br />
2.5<br />
14.5<br />
5.2 5.2<br />
5.6<br />
2.5<br />
5.4 5.6<br />
5.6<br />
NE<br />
5.8<br />
15<br />
10<br />
5<br />
50<br />
100<br />
150<br />
200<br />
SW<br />
6.4<br />
8.2<br />
10.8<br />
12<br />
12.2<br />
12.4<br />
7.4<br />
8.2<br />
12.5<br />
10.6<br />
11.8<br />
NE<br />
12<br />
11<br />
10<br />
9<br />
8<br />
7<br />
19.6 19.8 20 20.2 20.4<br />
19.6 19.8 20 20.2 20.4<br />
σ t<br />
(kg m −3 )<br />
O 2<br />
(ml/l)<br />
Depth (m)<br />
50<br />
100<br />
150<br />
200<br />
SW<br />
4<br />
6<br />
6.5<br />
8<br />
8.7<br />
9.1<br />
9.2<br />
9.6<br />
9.7<br />
9.8<br />
9.9<br />
5.5<br />
NE<br />
19.6 19.8 20 20.2 20.4<br />
Longitude ( o E)<br />
9<br />
8<br />
7<br />
6<br />
5<br />
4<br />
50<br />
100<br />
150<br />
200<br />
0.6<br />
0.2<br />
0.4<br />
SW<br />
6.8<br />
5.5<br />
2.5<br />
0.6<br />
7.6<br />
0.05<br />
6.8<br />
7.4<br />
1<br />
0.1<br />
0.4<br />
0.6<br />
1<br />
7.8<br />
NE<br />
0.4<br />
19.6 19.8 20 20.2 20.4<br />
Longitude ( o E)<br />
6<br />
4<br />
2<br />
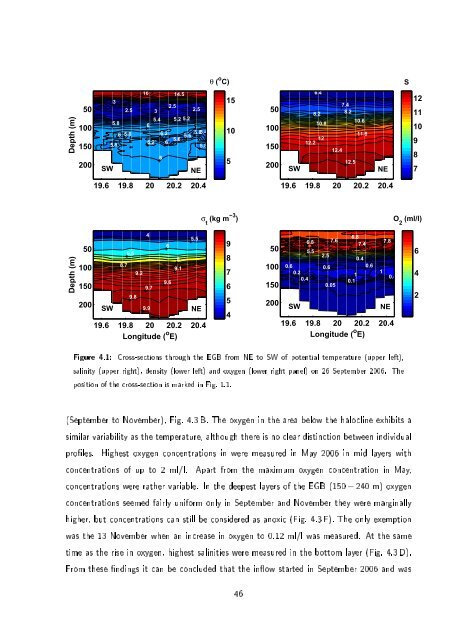
Figure 4.1: Cross-sections through the EGB from NE to SW of potential temperature (upper left),<br />
salinity (upper right), density (lower left) and oxygen (lower right panel) on 26 September 2006. The<br />
position of the cross-section is marked in Fig. 1.1.<br />
(September to November), Fig. 4.3 B. The oxygen in the area below the halocline exhibits a<br />
similar variability as the temperature, although there is no clear distinction between individual<br />
proles. Highest oxygen concentrations in were measured in May 2006 in mid layers with<br />
concentrations of up to 2 ml/l. Apart from the maximum oxygen concentration in May,<br />
concentrations were rather variable. In the deepest layers of the EGB (150 − 240 m) oxygen<br />
concentrations seemed fairly uniform only in September and November they were marginally<br />
higher, but concentrations can still be considered as anoxic (Fig. 4.3 F). The only exemption<br />
was the 13 November when an increase in oxygen to 0.12 ml/l was measured. At the same<br />
time as the rise in oxygen, highest salinities were measured in the bottom layer (Fig. 4.3 D).<br />
From these ndings it can be concluded that the inow started in September 2006 and was<br />
46
