

Baltic Sea
Baltic Sea
Baltic Sea

Create successful ePaper yourself
Turn your PDF publications into a flip-book with our unique Google optimized e-Paper software.
Modelled volume transport through Stolpe Channel<br />
15<br />
10<br />
VoltrpSF 9.5<br />
hourly<br />
VoltrpSF 9.5<br />
daily<br />
VoltrpSF 9.5<br />
5day<br />
VoltrpSF 12<br />
5day<br />
Transport (km 3 /d)<br />
5<br />
0<br />
5<br />
10<br />
15<br />
20/09 30/09 10/10 20/10 30/10 09/11 19/11 29/11 09/12 19/12 29/12<br />
Date in 2006 (dd/mm)<br />
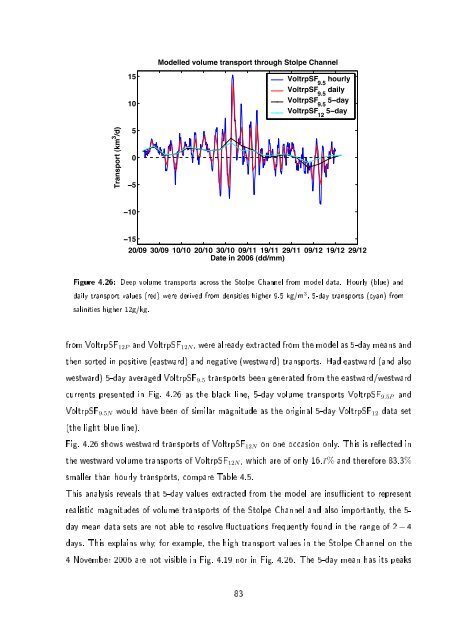
Figure 4.26: Deep volume transports across the Stolpe Channel from model data. Hourly (blue) and<br />
daily transport values (red) were derived from densities higher 9.5 kg/m 3 , 5-day transports (cyan) from<br />
salinities higher 12g/kg.<br />
from VoltrpSF 12P and VoltrpSF 12N , were already extracted from the model as 5-day means and<br />
then sorted in positive (eastward) and negative (westward) transports. Had eastward (and also<br />
westward) 5-day averaged VoltrpSF 9.5 transports been generated from the eastward/westward<br />
currents presented in Fig. 4.26 as the black line, 5-day volume transports VoltrpSF 9.5P and<br />
VoltrpSF 9.5N would have been of similar magnitude as the original 5-day VoltrpSF 12 data set<br />
(the light blue line).<br />
Fig. 4.26 shows westward transports of VoltrpSF 12N on one occasion only. This is reected in<br />
the westward volume transports of VoltrpSF 12N , which are of only 16.7% and therefore 83.3%<br />
smaller than hourly transports, compare Table 4.5.<br />
This analysis reveals that 5-day values extracted from the model are insucient to represent<br />
realistic magnitudes of volume transports of the Stolpe Channel and also importantly, the 5-<br />
day mean data sets are not able to resolve uctuations frequently found in the range of 2 − 4<br />
days. This explains why, for example, the high transport values in the Stolpe Channel on the<br />
4 November 2006 are not visible in Fig. 4.19 nor in Fig. 4.26. The 5-day mean has its peaks<br />
83
