

Baltic Sea
Baltic Sea
Baltic Sea

You also want an ePaper? Increase the reach of your titles
YUMPU automatically turns print PDFs into web optimized ePapers that Google loves.
θ ( o C)<br />
7<br />
100<br />
8.6<br />
6.5<br />
8.8<br />
Depth (m)<br />
150<br />
9.2<br />
9.4<br />
6<br />
200<br />
9.5<br />
a<br />
pot. Density contours (kg/m 3 9.55<br />
)<br />
19.6 19.7 19.8 19.9 20 20.1 20.2 20.3 20.4<br />
5.5<br />
5<br />
θ ( o C)<br />
7<br />
100<br />
9<br />
8.6<br />
9.2<br />
6.5<br />
Depth (m)<br />
150<br />
9.4<br />
9.5<br />
9.55 9.6<br />
6<br />
200<br />
9.7<br />
9.8<br />
b<br />
5.5<br />
pot. Density contours (kg/m 3 )<br />
19.6 19.7 19.8 19.9 20 20.1 20.2 20.3 20.4<br />
Longitude ( o E)<br />
5<br />
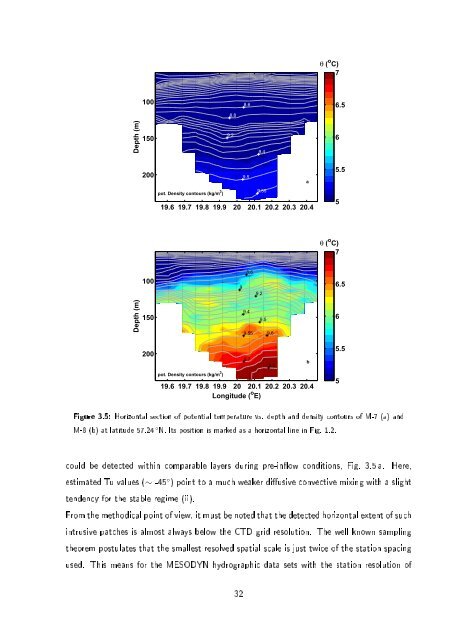
Figure 3.5: Horizontal section of potential temperature vs. depth and density contours of M-7 (a) and<br />
M-8 (b) at latitude 57.24 ◦ N. Its position is marked as a horizontal line in Fig. 1.2.<br />
could be detected within comparable layers during pre-inow conditions, Fig. 3.5 a. Here,<br />
estimated Tu values (∼ -45 ◦ ) point to a much weaker diusive convective mixing with a slight<br />
tendency for the stable regime (ii).<br />
From the methodical point of view, it must be noted that the detected horizontal extent of such<br />
intrusive patches is almost always below the CTD grid resolution. The well known sampling<br />
theorem postulates that the smallest resolved spatial scale is just twice of the station spacing<br />
used. This means for the MESODYN hydrographic data sets with the station resolution of<br />
32
