

Baltic Sea
Baltic Sea
Baltic Sea

You also want an ePaper? Increase the reach of your titles
YUMPU automatically turns print PDFs into web optimized ePapers that Google loves.
30<br />
15<br />
SFN/SFS (66−71) (cm/s)<br />
20<br />
10<br />
0<br />
−10<br />
−20<br />
Volume Transport (6671m) (km 3 /d)<br />
10<br />
5<br />
0<br />
5<br />
10<br />
−30<br />
−100 −80 −60 −40 −20 0 20 40 60 80 100<br />
SL ∆(VP−SA) (cm)<br />
15<br />
100 80 60 40 20 0 20 40 60 80 100<br />
SL (VPSA) (cm)<br />
A<br />
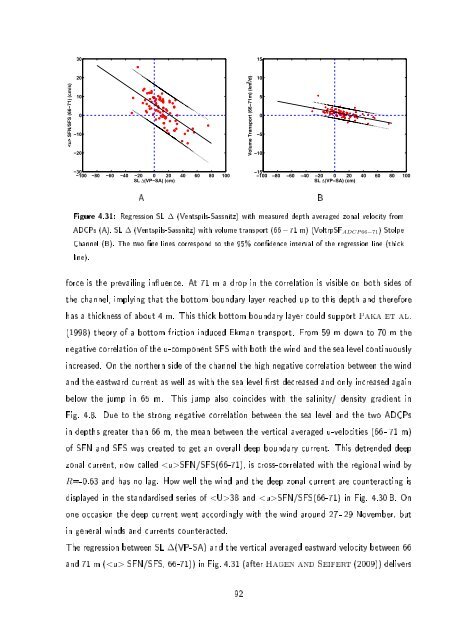
Figure 4.31: Regression SL ∆ (Ventspils-Sassnitz) with measured depth averaged zonal velocity from<br />
ADCPs (A). SL ∆ (Ventspils-Sassnitz) with volume transport (66 −71 m) (VoltrpSF ADCP 66−71 ) Stolpe<br />
Channel (B). The two ne lines correspond to the 95% condence interval of the regression line (thick<br />
line).<br />
force is the prevailing inuence. At 71 m a drop in the correlation is visible on both sides of<br />
the channel, implying that the bottom boundary layer reached up to this depth and therefore<br />
has a thickness of about 4 m. This thick bottom boundary layer could support Paka et al.<br />
(1998) theory of a bottom friction induced Ekman transport. From 59 m down to 70 m the<br />
negative correlation of the u-component SFS with both the wind and the sea level continuously<br />
increased. On the northern side of the channel the high negative correlation between the wind<br />
and the eastward current as well as with the sea level rst decreased and only increased again<br />
below the jump in 65 m. This jump also coincides with the salinity/ density gradient in<br />
Fig. 4.8. Due to the strong negative correlation between the sea level and the two ADCPs<br />
in depths greater than 66 m, the mean between the vertical averaged u-velocities (66 - 71 m)<br />
of SFN and SFS was created to get an overall deep boundary current. This detrended deep<br />
zonal current, now called SFN/SFS(66-71), is cross-correlated with the regional wind by<br />
R=-0.63 and has no lag. How well the wind and the deep zonal current are counteracting is<br />
displayed in the standardised series of 38 and SFN/SFS(66-71) in Fig. 4.30 B. On<br />
one occasion the deep current went accordingly with the wind around 27 - 29 November, but<br />
in general winds and currents counteracted.<br />
The regression between SL ∆(VP-SA) and the vertical averaged eastward velocity between 66<br />
and 71 m ( SFN/SFS, 66-71)) in Fig. 4.31 (after Hagen and Seifert (2009)) delivers<br />
92<br />
B
