

Baltic Sea
Baltic Sea
Baltic Sea

You also want an ePaper? Increase the reach of your titles
YUMPU automatically turns print PDFs into web optimized ePapers that Google loves.
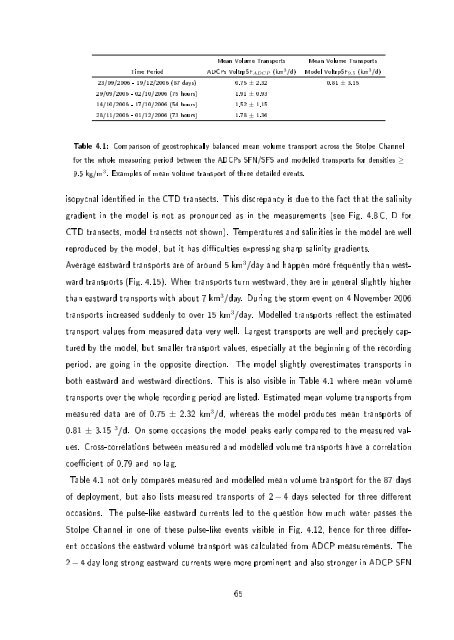
Mean Volume Transports Mean Volume Transports<br />
Time Period ADCPs VoltrpSF ADCP (km 3 /d) Model VoltrpSF 9.5 (km 3 /d)<br />
23/09/2006 - 19/12/2006 (87 days) 0.75 ± 2.32 0.81 ± 3.15<br />
29/09/2006 - 02/10/2006 (75 hours) 1.91 ± 0.93<br />
14/10/2006 - 17/10/2006 (54 hours) 1.52 ± 1.15<br />
28/11/2006 - 01/12/2006 (73 hours) 1.78 ± 1.36<br />
Table 4.1: Comparison of geostrophically balanced mean volume transport across the Stolpe Channel<br />
for the whole measuring period between the ADCPs SFN/SFS and modelled transports for densities ≥<br />
9.5 kg/m 3 . Examples of mean volume transport of three detailed events.<br />
isopycnal identied in the CTD transects. This discrepancy is due to the fact that the salinity<br />
gradient in the model is not as pronounced as in the measurements (see Fig. 4.8 C, D for<br />
CTD transects, model transects not shown). Temperatures and salinities in the model are well<br />
reproduced by the model, but it has diculties expressing sharp salinity gradients.<br />
Average eastward transports are of around 5 km 3 /day and happen more frequently than westward<br />
transports (Fig. 4.15). When transports turn westward, they are in general slightly higher<br />
than eastward transports with about 7 km 3 /day. During the storm event on 4 November 2006<br />
transports increased suddenly to over 15 km 3 /day. Modelled transports reect the estimated<br />
transport values from measured data very well. Largest transports are well and precisely captured<br />
by the model, but smaller transport values, especially at the beginning of the recording<br />
period, are going in the opposite direction. The model slightly overestimates transports in<br />
both eastward and westward directions. This is also visible in Table 4.1 where mean volume<br />
transports over the whole recording period are listed. Estimated mean volume transports from<br />
measured data are of 0.75 ± 2.32 km 3 /d, whereas the model produces mean transports of<br />
0.81 ± 3.15 3 /d. On some occasions the model peaks early compared to the measured values.<br />
Cross-correlations between measured and modelled volume transports have a correlation<br />
coecient of 0.79 and no lag.<br />
Table 4.1 not only compares measured and modelled mean volume transport for the 87 days<br />
of deployment, but also lists measured transports of 2 − 4 days selected for three dierent<br />
occasions. The pulse-like eastward currents led to the question how much water passes the<br />
Stolpe Channel in one of these pulse-like events visible in Fig. 4.12, hence for three dierent<br />
occasions the eastward volume transport was calculated from ADCP measurements. The<br />
2 − 4 day long strong eastward currents were more prominent and also stronger in ADCP SFN<br />
65
