

Baltic Sea
Baltic Sea
Baltic Sea

Create successful ePaper yourself
Turn your PDF publications into a flip-book with our unique Google optimized e-Paper software.
Salt (t)<br />
8<br />
6<br />
4<br />
2<br />
0<br />
2<br />
4<br />
6<br />
8<br />
x 10 10<br />
Cumulative Salt through Gdansk Basin at 55N <br />
5day means of salinity > 12 g/kg<br />
pos and neg<br />
pos<br />
neg<br />
11/10/02 23/02/04 07/07/05 19/11/06 02/04/08 15/08/09<br />
Date (dd/mm/yy)<br />
(a) 2002 −2009<br />
Salt (t)<br />
1<br />
0.5<br />
0<br />
−0.5<br />
−1<br />
x 10 10<br />
Cumulative Salt through Gdansk Basin at 55N −<br />
5−day means of salinity > 12 g/kg<br />
pos and neg<br />
pos<br />
neg<br />
03/05/06 22/06/06 11/08/06 30/09/06 19/11/06 08/01/07 27/02/07 18/04/07<br />
Date (dd/mm/yy)<br />
(b) May 2006 −March 2007<br />
Cumulative Salt through Gdansk Basin at 55N −<br />
5−day means of salinity > 12 g/kg<br />
4 x 10⁹ Date in 2006 (dd/mm)<br />
3<br />
pos and neg<br />
pos<br />
neg<br />
2<br />
1<br />
Salt (t)<br />
0<br />
−1<br />
−2<br />
−3<br />
−4<br />
20/09 30/09 10/10 20/10 30/10 09/11 19/11 29/11 09/12 19/12 29/12<br />
(c) September to December 2006<br />
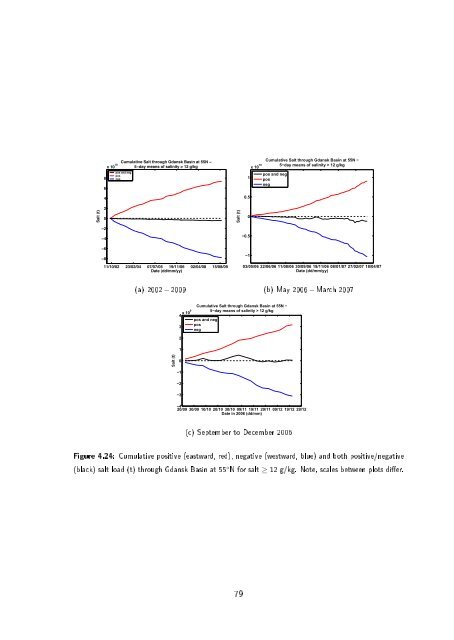
Figure 4.24: Cumulative positive (eastward, red), negative (westward, blue) and both positive/negative<br />
(black) salt load (t) through Gdansk Basin at 55 ◦ N for salt ≥ 12 g/kg. Note, scales between plots dier.<br />
79
