

Baltic Sea
Baltic Sea
Baltic Sea

You also want an ePaper? Increase the reach of your titles
YUMPU automatically turns print PDFs into web optimized ePapers that Google loves.
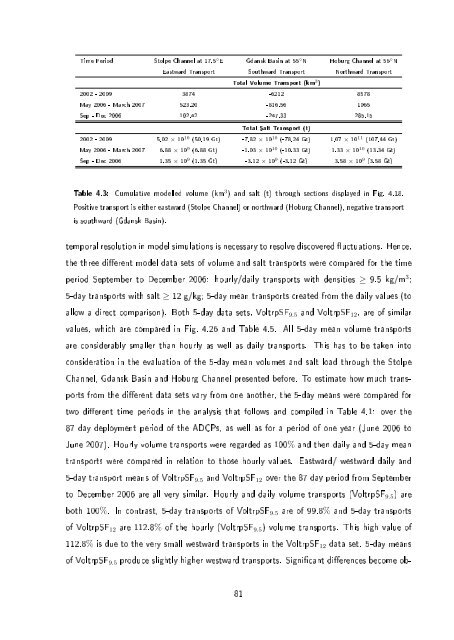
Time Period Stolpe Channel at 17.5 ◦ E Gdansk Basin at 55 ◦ N Hoburg Channel at 56 ◦ N<br />
Eastward Transport Southward Transport Northward Transport<br />
Total Volume Transport (km 3 )<br />
2002 - 2009 3874 -6212 8578<br />
May 2006 - March 2007 523.20 -816.56 1065<br />
Sep - Dec 2006 102.42 -247.33 285.15<br />
Total Salt Transport (t)<br />
2002 - 2009 5.02 × 10 10 (50.19 Gt) -7.82 × 10 10 (-78.24 Gt) 1.07 × 10 11 (107.44 Gt)<br />
May 2006 - March 2007 6.88 × 10 9 (6.88 Gt) -1.03 × 10 10 (-10.33 Gt) 1.33 × 10 10 (13.34 Gt)<br />
Sep - Dec 2006 1.35 × 10 9 (1.35 Gt) -3.12 × 10 9 (-3.12 Gt) 3.58 × 10 9 (3.58 Gt)<br />
Table 4.3: Cumulative modelled volume (km 3 ) and salt (t) through sections displayed in Fig. 4.18.<br />
Positive transport is either eastward (Stolpe Channel) or northward (Hoburg Channel), negative transport<br />
is southward (Gdansk Basin).<br />
temporal resolution in model simulations is necessary to resolve discovered uctuations. Hence,<br />
the three dierent model data sets of volume and salt transports were compared for the time<br />
period September to December 2006: hourly/daily transports with densities ≥ 9.5 kg/m 3 ;<br />
5-day transports with salt ≥ 12 g/kg; 5-day mean transports created from the daily values (to<br />
allow a direct comparison). Both 5-day data sets, VoltrpSF 9.5 and VoltrpSF 12 , are of similar<br />
values, which are compared in Fig. 4.26 and Table 4.5. All 5-day mean volume transports<br />
are considerably smaller than hourly as well as daily transports. This has to be taken into<br />
consideration in the evaluation of the 5-day mean volumes and salt load through the Stolpe<br />
Channel, Gdansk Basin and Hoburg Channel presented before. To estimate how much transports<br />
from the dierent data sets vary from one another, the 5-day means were compared for<br />
two dierent time periods in the analysis that follows and compiled in Table 4.1: over the<br />
87 day deployment period of the ADCPs, as well as for a period of one year (June 2006 to<br />
June 2007). Hourly volume transports were regarded as 100% and then daily and 5-day mean<br />
transports were compared in relation to those hourly values. Eastward/ westward daily and<br />
5-day transport means of VoltrpSF 9.5 and VoltrpSF 12 over the 87 day period from September<br />
to December 2006 are all very similar. Hourly and daily volume transports (VoltrpSF 9.5 ) are<br />
both 100%. In contrast, 5-day transports of VoltrpSF 9.5 are of 99.8% and 5-day transports<br />
of VoltrpSF 12 are 112.8% of the hourly (VoltrpSF 9.5 ) volume transports. This high value of<br />
112.8% is due to the very small westward transports in the VoltrpSF 12 data set. 5-day means<br />
of VoltrpSF 9.5 produce slightly higher westward transports. Signicant dierences become ob-<br />
81
