

Baltic Sea
Baltic Sea
Baltic Sea

You also want an ePaper? Increase the reach of your titles
YUMPU automatically turns print PDFs into web optimized ePapers that Google loves.
Volume transports (km 3 /d)<br />
15<br />
10<br />
5<br />
0<br />
−5<br />
−10<br />
Modelled Volume Transports for Salinity greater 12 g/kg<br />
Stolpe Channel at 17.5E eastw<br />
Gdansk Basin at 55N southw<br />
Gdansk Basin at 56N northw<br />
−15<br />
11/10/02 23/02/04 07/07/05 19/11/06 02/04/08 15/08/09<br />
Date (dd/mm/yy)<br />
Volume transports (km 3 /d)<br />
8<br />
6<br />
4<br />
2<br />
0<br />
−2<br />
−4<br />
−6<br />
−8<br />
Modelled Volume Transports for Salinity greater 12 g/kg<br />
Stolpe Channel at 17.5E eastw<br />
Gdansk Basin at 55N southw<br />
Hoburg Channel at 56N northw<br />
22/06 11/08 30/09 19/11 08/01 27/02<br />
Date (dd/mm/yy)<br />
A<br />
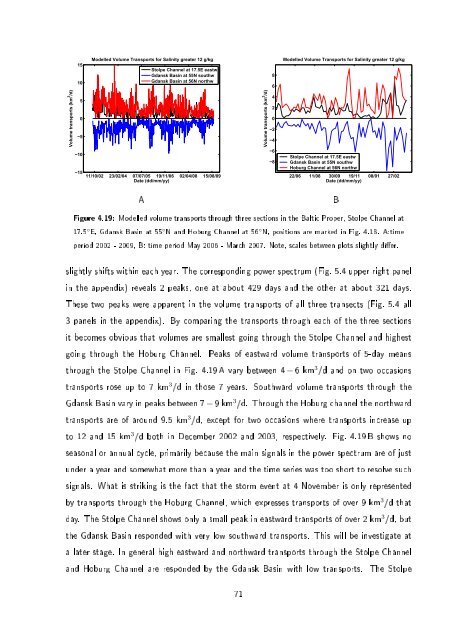
Figure 4.19: Modelled volume transports through three sections in the <strong>Baltic</strong> Proper, Stolpe Channel at<br />
17.5 ◦ E, Gdansk Basin at 55 ◦ N and Hoburg Channel at 56 ◦ N, positions are marked in Fig. 4.18. A:time<br />
period 2002 - 2009, B: time period May 2006 - March 2007. Note, scales between plots slightly dier.<br />
slightly shifts within each year. The corresponding power spectrum (Fig. 5.4 upper right panel<br />
in the appendix) reveals 2 peaks, one at about 429 days and the other at about 321 days.<br />
These two peaks were apparent in the volume transports of all three transects (Fig. 5.4 all<br />
3 panels in the appendix). By comparing the transports through each of the three sections<br />
it becomes obvious that volumes are smallest going through the Stolpe Channel and highest<br />
going through the Hoburg Channel. Peaks of eastward volume transports of 5-day means<br />
through the Stolpe Channel in Fig. 4.19 A vary between 4 − 6 km 3 /d and on two occasions<br />
transports rose up to 7 km 3 /d in those 7 years. Southward volume transports through the<br />
Gdansk Basin vary in peaks between 7 − 9 km 3 /d. Through the Hoburg channel the northward<br />
transports are of around 9.5 km 3 /d, except for two occasions where transports increase up<br />
to 12 and 15 km 3 /d both in December 2002 and 2003, respectively. Fig. 4.19 B shows no<br />
seasonal or annual cycle, primarily because the main signals in the power spectrum are of just<br />
under a year and somewhat more than a year and the time series was too short to resolve such<br />
signals. What is striking is the fact that the storm event at 4 November is only represented<br />
by transports through the Hoburg Channel, which expresses transports of over 9 km 3 /d that<br />
day. The Stolpe Channel shows only a small peak in eastward transports of over 2 km 3 /d, but<br />
the Gdansk Basin responded with very low southward transports. This will be investigate at<br />
a later stage. In general high eastward and northward transports through the Stolpe Channel<br />
and Hoburg Channel are responded by the Gdansk Basin with low transports. The Stolpe<br />
71<br />
B
