

Baltic Sea
Baltic Sea
Baltic Sea

Create successful ePaper yourself
Turn your PDF publications into a flip-book with our unique Google optimized e-Paper software.
model was capable of replicating all major events found in the measurements. The velocities<br />
were slightly lower, but all in all the model results are very good.<br />
The ow of the eastward current seems to be pulse-like, with each pulse-like event lasting about<br />
2 − 4 days. This is more obvious in the daily currents in Fig. 4.12. Comparing the height of<br />
the eastward ow's upper boundary layer between the northern and southern ank i.e. SFN<br />
and SFS, a slope similar to the slope of the salinity/ density gradient in the hydrographic crosssection<br />
was observed (compare Fig. 4.8). This south-north slope becomes more apparent in<br />
Fig. 4.13 indicating that time averaged mean velocities tend to go westward in the top layer<br />
and turn eastward in the bottom layer from 52 m to the bottom at SFS and 65 m at SFN.<br />
Fig. 4.13 shows that the eastward bottom ow at the northern ank of the channel (left panel)<br />
has only a thickness of about 6 m in the vertical, but exhibits a larger range in velocities by<br />
higher standard deviations. On the southern ank of the channel the eastward ow reached<br />
higher up in the water column with a thickness of 19 m but exhibited slightly slower velocities.<br />
After the strong storm event on 4 November 2006 longer periods of westward currents were<br />
especially at SFN observed (Fig. 4.12 upper panel). They seemed to be initiated from the<br />
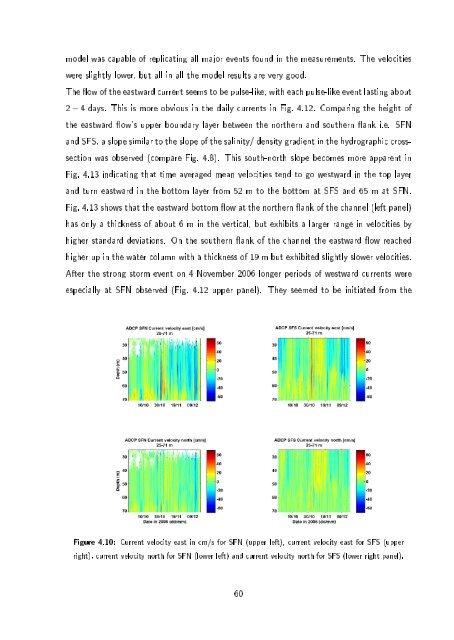
Figure 4.10: Current velocity east in cm/s for SFN (upper left), current velocity east for SFS (upper<br />
right), current velocity north for SFN (lower left) and current velocity north for SFS (lower right panel).<br />
60
