

Baltic Sea
Baltic Sea
Baltic Sea

Create successful ePaper yourself
Turn your PDF publications into a flip-book with our unique Google optimized e-Paper software.
Depth (m)<br />
50<br />
100<br />
150<br />
200<br />
a<br />
250<br />
2.5 3 3.5 4 4.5 5 5.5 6 6.5 7 7.5 8<br />
θ ( o C)<br />
8 x 10⁻³ Days since 31 August 1997<br />
Var θ , (K 2 )<br />
6<br />
4<br />
2<br />
b<br />
0<br />
0 50 100 150 200 250 300 350 400 450<br />
4<br />
x 10 −5<br />
c<br />
κ θ<br />
(m 2 /s)<br />
2<br />
0<br />
0 1 2 3 4 5 6 7 8 9 10<br />
L (m)<br />
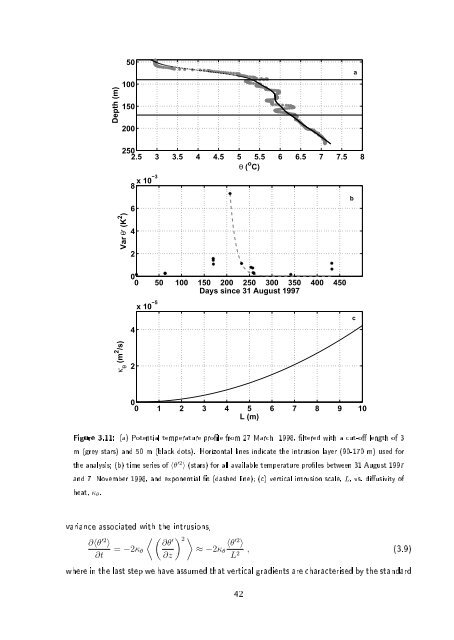
Figure 3.11: (a) Potential temperature prole from 27 March 1998, ltered with a cut-o length of 3<br />
m (grey stars) and 50 m (black dots). Horizontal lines indicate the intrusion layer (90-170 m) used for<br />
the analysis; (b) time series of 〈θ ′2 〉 (stars) for all available temperature proles between 31 August 1997<br />
and 7 November 1998, and exponential t (dashed line); (c) vertical intrusion scale, L, vs. diusivity of<br />
heat, κ θ .<br />
variance associated with the intrusions,<br />
∂〈θ ′2 〉<br />
∂t<br />
〈 ( ) ∂θ<br />
′ 2 〉<br />
= −2κ θ<br />
∂z<br />
≈ −2κ θ<br />
〈θ ′2 〉<br />
L 2 , (3.9)<br />
where in the last step we have assumed that vertical gradients are characterised by the standard<br />
42
