Analysis and Ranking of the Acoustic Disturbance Potential of ...
Analysis and Ranking of the Acoustic Disturbance Potential of ...
Analysis and Ranking of the Acoustic Disturbance Potential of ...
Create successful ePaper yourself
Turn your PDF publications into a flip-book with our unique Google optimized e-Paper software.
Report No. 6945<br />
BBN Systems <strong>and</strong> Technologies Corporation<br />
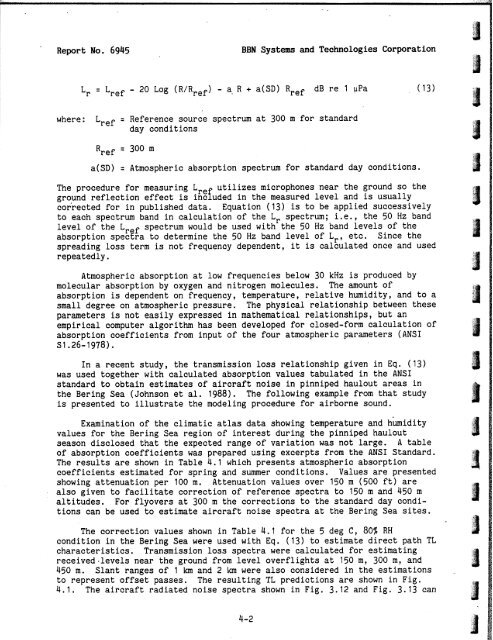
Lr = Lref - 20 Log R R e f - a. R + a(SD) Rref dB re 1 uPa (13)<br />
where: Lref = Reference source spectrum at 300 m for st<strong>and</strong>ard<br />
day conditions<br />
a(SD) = Atmospheric absorption spectrum for st<strong>and</strong>ard day conditions.<br />
The procedure for measuring Lre utilizes microphones near <strong>the</strong> ground so <strong>the</strong><br />
ground reflection effect is inc f uded in <strong>the</strong> measured level <strong>and</strong> is usually<br />
corrected for in published data. Equation ( 13) is to be applied successively<br />
to each spectrum b<strong>and</strong> in calculation <strong>of</strong> <strong>the</strong> Lr spectrum; i.e., <strong>the</strong> 50 Hz b<strong>and</strong><br />
level <strong>of</strong> <strong>the</strong> Lr spectrum would be used with <strong>the</strong> 50 Hz b<strong>and</strong> levels <strong>of</strong> <strong>the</strong><br />
absorption spectra to determine <strong>the</strong> 50 Hz b<strong>and</strong> level <strong>of</strong> Lr, etc. Since <strong>the</strong><br />
spreading loss term is not frequency dependent, it is calculated once <strong>and</strong> used<br />
repeatedly.<br />
Atmospheric absorption at low frequencies below 30 kHz is produced by<br />
molecular absorption by oxygen <strong>and</strong> nitrogen molecules. The amount <strong>of</strong><br />
absorption is dependent on frequency, temperature, relative humidity, <strong>and</strong> to a<br />
small degree on atmospheric pressure. The physical relationship between <strong>the</strong>se<br />
parameters is not easily expressed in ma<strong>the</strong>matical relationships, but an<br />
empirical computer algorithm has been developed for closed-form calculation <strong>of</strong><br />
absorption coefficients from input <strong>of</strong> <strong>the</strong> four atmospheric parameters (ANSI<br />
S1.26-1978).<br />
In a recent study, <strong>the</strong> transmission loss relationship given in Eq. (13)<br />
was used toge<strong>the</strong>r with calculated absorption values tabulated in <strong>the</strong> ANSI<br />
st<strong>and</strong>ard to obtain estimates <strong>of</strong> aircraft noise in pinniped haulout areas in<br />
<strong>the</strong> Bering Sea (Johnson et al. 1988). The following example from that study<br />
is presented to illustrate <strong>the</strong> modeling procedure for airborne sound.<br />
Examination <strong>of</strong> <strong>the</strong> climatic atlas data showing temperature <strong>and</strong> humidity<br />
values for <strong>the</strong> Bering Sea region <strong>of</strong> interest during <strong>the</strong> pinniped haulout<br />
season disclosed that <strong>the</strong> expected range <strong>of</strong> variation was not large. A table<br />
<strong>of</strong> absorption coefficients was prepared using excerpts from <strong>the</strong> ANSI St<strong>and</strong>ard.<br />
The results are shown in Table 4.1 which presents atmospheric absorption<br />
coefficients estimated for spring <strong>and</strong> summer conditions. Values are presented<br />
showing attenuation per 100 m. Attenuation values over 150 m (500 ft) are<br />
also given to facilitate correction <strong>of</strong> reference spectra to 150 m <strong>and</strong> 450 m<br />
altitudes. For flyovers at 300 m <strong>the</strong> corrections to <strong>the</strong> st<strong>and</strong>ard day conditions<br />
can be used to estimate aircraft noise spectra at <strong>the</strong> Bering Sea sites.<br />
The correction values shown in Table 4.1 for <strong>the</strong> 5 deg C, 80% RH<br />
condition in <strong>the</strong> Bering Sea were used with Eq. (13) to estimate direct path TL<br />
characteristics. Transmission loss spectra were calculated for estimating<br />
received-levels near <strong>the</strong> ground from level overflights at 150 m, 300 m, <strong>and</strong><br />
450 m. Slant ranges <strong>of</strong> 1 km <strong>and</strong> 2 km were also considered in <strong>the</strong> estimations<br />
to represent <strong>of</strong>fset passes. The resulting TL predictions are shown in Fig.<br />
4.1. The aircraft radiated noise spectra shown in Fig. 3.12 <strong>and</strong> Fig. 3.13 can


