

Analysis and Ranking of the Acoustic Disturbance Potential of ...
Analysis and Ranking of the Acoustic Disturbance Potential of ...
Analysis and Ranking of the Acoustic Disturbance Potential of ...

You also want an ePaper? Increase the reach of your titles
YUMPU automatically turns print PDFs into web optimized ePapers that Google loves.
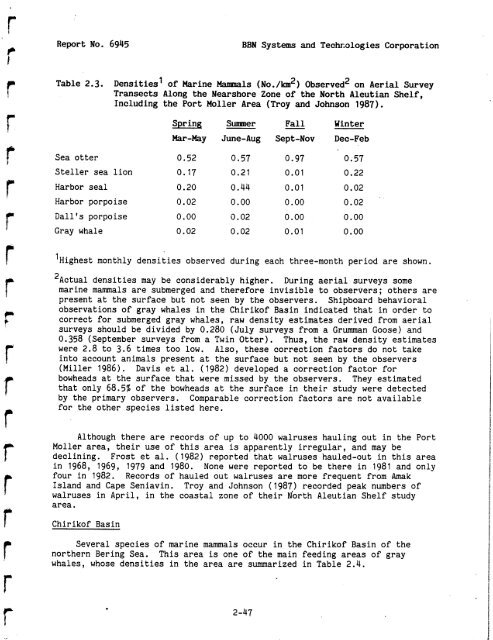
Report No. 6945<br />
BBN Systems <strong>and</strong> Te~h~ologies Corporation<br />
Table 2.3.<br />
~ensities' <strong>of</strong> Marine Mamals (~o./km~) observed2 on Aerial Survey<br />
Transects Along <strong>the</strong> Nearshore Zone <strong>of</strong> <strong>the</strong> North Aleutian Shelf,<br />
Including <strong>the</strong> Port Moller Area (Troy <strong>and</strong> Johnson 1987).<br />
Spr in6 Summer Fall Winter<br />
Mar-May June-Aug Sept-Nov Dec-Feb<br />
Sea otter 0.52 0.57 0.97 0.57<br />
Steller sea lion 0.17 0.21 0.01 0.22<br />
Harbor seal 0.20 0.44 0.01 0.02<br />
Harbor porpoise 0.02 0.00 0.00 0.02<br />
Dall's porpoise 0.00 0.02 0.00 0.00<br />
Gray whale 0.02 0.02 0.01 0.00<br />
l~i~hest monthly densities observed during each three-month period are shown.<br />
'~ctual densities may be considerably higher. During aerial surveys some<br />
marine mammals are submerged <strong>and</strong> <strong>the</strong>refore invisible to observers; o<strong>the</strong>rs are<br />
present at <strong>the</strong> surface but not seen by <strong>the</strong> observers. Shipboard behavioral<br />
observations <strong>of</strong> gray whales in <strong>the</strong> Chirik<strong>of</strong> Basin indicated that in order to<br />
correct for submerged gray whales, raw density estimates derived from aerial<br />
surveys should be divided by 0.280 (July surveys from a Grumman Goose) <strong>and</strong><br />
0.358 (September surveys from a Twin Otter). Thus, <strong>the</strong> raw density estimates<br />
were 2.8 to 3.6 times too low. Also, <strong>the</strong>se correction factors do not take<br />
into account animals present at <strong>the</strong> surface but not seen by <strong>the</strong> observers<br />
(Miller 1986). Davis et al. (1982) developed a correction factor for<br />
bowheads at <strong>the</strong> surface that were missed by <strong>the</strong> observers. They estimated<br />
that only 68.5% <strong>of</strong> <strong>the</strong> bowheads at <strong>the</strong> surface in <strong>the</strong>ir study were detected<br />
by <strong>the</strong> primary observers. Comparable correction factors are not available<br />
for <strong>the</strong> o<strong>the</strong>r species listed here.<br />
Although <strong>the</strong>re are records <strong>of</strong> up to 4000 walruses hauling out in <strong>the</strong> Port<br />
Moller area, <strong>the</strong>ir use <strong>of</strong> this area is apparently irregular, <strong>and</strong> may be<br />
declining. Frost et al. (1982) reported that walruses hauled-out in this area<br />
in 1968, 1969, 1979 <strong>and</strong> 1980. None were reported to be <strong>the</strong>re in 1981 <strong>and</strong> only<br />
four in 1982. Records <strong>of</strong> hauled out walruses are more frequent from Amak<br />
Isl<strong>and</strong> <strong>and</strong> Cape Seniavin. Troy <strong>and</strong> Johnson (1987) recorded peak numbers <strong>of</strong><br />
walruses in April, in <strong>the</strong> coastal zone <strong>of</strong> <strong>the</strong>ir ~orth Aleutian Shelf study<br />
area.<br />
Chirik<strong>of</strong> Basin<br />
Several species <strong>of</strong> marine mammals occur in <strong>the</strong> Chirik<strong>of</strong> Basin <strong>of</strong> <strong>the</strong><br />
nor<strong>the</strong>rn Bering Sea. This area is one <strong>of</strong> <strong>the</strong> main feeding areas <strong>of</strong> gray<br />
whales, whose densities in <strong>the</strong> area are summarized in Table 2.4.


