- Page 1 and 2:
BBN Svstems and Technologies Cor~or
- Page 3 and 4:
Report No. 6945 BBN Systems and Tec
- Page 5 and 6:
Report No. 6945 BBN Systems and Tec
- Page 7 and 8:
Report No. 6945 BBN Systems and Tec
- Page 9 and 10:
Report No. 6945 BBN Systems and Tec
- Page 11 and 12:
Report No. 6945 BBN Systems and Tec
- Page 13 and 14:
Report No. 6945 BBN Systems and Tec
- Page 15 and 16:
Report No. 6945 BBN Systems and Tec
- Page 18 and 19:
Report No. 6945 BBN Systems and Tec
- Page 20 and 21:
H BOWERS BAW I ALEUTIAN ARC 3 STGEC
- Page 23 and 24:
Report No. 6945 BBN Systems and Tec
- Page 25:
Report No. 6945 BBN Systems and Tec
- Page 29 and 30:
Report No. 6945 BBN Systems and Tec
- Page 31 and 32:
A BEAUFORT SEA B U WCH SEA CHOPEaAS
- Page 33 and 34:
Report No. 6945 L 1 A. Baird's Beak
- Page 36 and 37:
Report No. 6945 BBN Systems and Tec
- Page 38 and 39:
A BEAUFCRT SEA B CHW(CH SEA CHOPEBA
- Page 40 and 41:
A BEAUFCRT SEA BWKQIYA DrnTONBAsw E
- Page 42 and 43:
A BEAUFORT SEA BCHlKCHSEA CHaeEansr
- Page 45 and 46:
on the ice. The single calves remai
- Page 47 and 48:
A 0EAUFaAT SEA BCHJKCH 9 A CHaPE BA
- Page 49 and 50:
BCmrcCHSEA CHOPEBnsw 0 NORTON 0Am E
- Page 51 and 52:
.. A BEWORT SEA B WKCH SEA CH)PEBAS
- Page 53 and 54:
Report No. 6945 BBN Systems and ~ec
- Page 55:
Report No. 6945 BBN Systems and Tec
- Page 58 and 59:
l fjG 1 ll.1 16:' 1 GI) 158 15.1 1
- Page 60 and 61:
Report No. 6945 BBN Systems and Te~
- Page 62 and 63:
Report No. 6945 BBN Systems and Tec
- Page 64 and 65:
Report No. 6945 BBN Systems and Tec
- Page 66 and 67:
Table 2.8. Characteristics of Under
- Page 68 and 69:
Report No. 6945 BBN Systems and Tec
- Page 70 and 71:
Report No. 6945 BBN Systems and Tec
- Page 72 and 73:
Report No. 6945 BBN Systems and Tec
- Page 74 and 75:
Report No. 6945 BBN Systems and Tec
- Page 76 and 77:
Report No. 6945 BBN Systems and Tec
- Page 78 and 79:
Report No. 6945 BBN Systems arid Te
- Page 80 and 81:
Report No. 6945 BBN Systems and Tec
- Page 82 and 83:
Report No'. 6945 BBN Systems and Te
- Page 84 and 85:
Report No. 6945 , BBN Systems and T
- Page 86 and 87:
Report No. 6945 BBN Systems and Tec
- Page 88 and 89:
Report No. 6945 BBN Systems and Tec
- Page 90 and 91:
Report No. 6945 BBN Systems and Tec
- Page 92 and 93:
Report No. 6945 BBN Systems and Tec
- Page 94 and 95:
Report No. 6945 BBN Systems and Tec
- Page 96 and 97:
Report No. 6945 BBN Systems and Tec
- Page 98 and 99:
Report No. 6945 BBN Systems and Tec
- Page 100 and 101:
Report No. 6945 BBN Systems and Tec
- Page 102 and 103:
Report No, 6945 BBN Systems and Tec
- Page 104 and 105:
Report No. 6945 BBN systems and Tec
- Page 106 and 107:
FIG. 3.2 NOISE SPECTRA IN SHALLOW W
- Page 108 and 109:
Report No. 6945 BBN Systems and Tec
- Page 110 and 111:
Report No. 6945 BBN Systems and Tec
- Page 112 and 113:
Adapted From K.H. Jacob (1986) Cali
- Page 114 and 115:
FIG. 3.8 ESTIMATED OVERALL SOUND LE
- Page 116 and 117:
Report No. 6945 BBN Systems and Tec
- Page 118 and 119:
FIG. 3. Q UNDERWATER NOISE SPECTRA
- Page 120 and 121:
Report No. 6945 BBN Systems and Tec
- Page 122 and 123:
Report No. 6945 BBN Systems and Tec
- Page 124 and 125:
FIG- 3.1 1 STATISTICAL ANALYSIS OF
- Page 126 and 127:
FIG- 3-12 STATISTICAL ANALYSIS OF C
- Page 128 and 129:
-- Alr Gun Array + Vlbrosels -* Ice
- Page 130 and 131:
Report No. 6945 BBN Systems and Tec
- Page 132 and 133:
FIG. 3.14 REPRESENTATIVE SHIPS AND
- Page 134 and 135:
BBN Systems and Technologies Corpor
- Page 136 and 137:
~ -- -- FIG. 3.1 7 REPRESENTATIVE R
- Page 138 and 139:
FIG. 3-18 REPRESENTATIVE CULTURAL S
- Page 140 and 141:
Report No. 6945 BBN Systems and Tec
- Page 142 and 143:
FIG. 4.1 CORRECTION TO 300 M REFERE
- Page 144 and 145:
Report No. 6945 BBN Systems and Tec
- Page 146 and 147:
Report No. 6945 BBN Systems and Tec
- Page 148 and 149:
Report No. 6945 BBN Systems and Tec
- Page 150 and 151:
Report No. 6945 BBN Systems and Tec
- Page 152 and 153:
A. 6. ~la~onca 011shwe. mm I C. MSI
- Page 154 and 155:
Report No. 6945 BRN Systems and Tec
- Page 156 and 157:
Report No. 6945 BBN Systems and Tec
- Page 158 and 159:
Report No. 6945 BBN Systems and Tec
- Page 160 and 161:
FIG. 4.1 1 AIR TO SHALLOW WATER SOU
- Page 162 and 163:
Report No. 6945 BBN Systems and Tec
- Page 164:
Report No. 6945 BBN Systems and Tec
- Page 167 and 168:
Report No. 6945 BBN Systems and Tec
- Page 169 and 170:
Report No. 6945 BBN Systems and Tec
- Page 171 and 172:
Report No. 6945 BBN Systems and Tec
- Page 173 and 174:
Report No. 6945 BBN Systems and Tec
- Page 175 and 176:
Report No. 6945 BBN Systems and Tec
- Page 177 and 178:
Report No. 6945 BBN Systems and Tec
- Page 179 and 180:
Report No. 6945 BBN Systems and Tec
- Page 181 and 182:
Report No. 6945 BBN Systems and Tec
- Page 183 and 184:
Report No. 6945 BBN Systems and Tec
- Page 185 and 186:
Report No. 6945 BBN Systems and Tec
- Page 187 and 188:
Report No. 6945 BBN Systems and Tec
- Page 189 and 190:
Report No. 6945 BBN Systems and Tec
- Page 191 and 192:
Report No. 6945 BBN Systems and Tec
- Page 193 and 194:
Report No. 6945 BBN Systems and Tec
- Page 195 and 196:
Report No. 6945 BBN Systems and Tec
- Page 197 and 198:
Report No. 6945 BBN Systems and Tec
- Page 199 and 200:
Report No. 6945 BBN Systems and Tec
- Page 201 and 202:
Report No. 6945 BBN Systems and Tec
- Page 203 and 204:
Report No. 6945 BBN Systems and Tec
- Page 205 and 206:
Report No. 6945 BBN Systems and Tec
- Page 207 and 208:
Report No. 6945 BBN Systems and Tec
- Page 209 and 210:
Report No. 6945 BBN Systems and Tec
- Page 211 and 212:
Report No. 6945 BBN Systems and Tec
- Page 213 and 214:
Report No. 6945 BBN Systems and Tec
- Page 215 and 216:
Report No. 6945 BBN Systems and Tec
- Page 217 and 218:
Report No. 6945 BBN Systems and Tec
- Page 219 and 220:
Report No. 6945 BBN Systems and Tec
- Page 221 and 222:
~epbrt No. 6945 BBN Systems and Tec
- Page 223 and 224:
Report No. 6945 BBN Systems and Tec
- Page 225 and 226:
Report No. 6945 BBN Systems and Tec
- Page 227 and 228:
Report No. 6945 BBN Systems and Tec
- Page 229 and 230:
Report No. 6945 BBN Systems and Tec
- Page 231 and 232:
Report No. ,6945 BBN Systems and Te
- Page 233 and 234: Report No. 6945 BBN Systems and Tec
- Page 235 and 236: Report No. 6945 BBN Systems and Tec
- Page 237 and 238: Report No. 6945 BBN Systems and Tec
- Page 239 and 240: Report No. 6945 BBN Systems and Tec
- Page 241 and 242: Report No. 6945 BBN Systems and Tec
- Page 243 and 244: Report No. 6945 BBN Systems and Tec
- Page 245 and 246: Report No. 6945 BBN Systems and Tec
- Page 247 and 248: Report No. 6945 BBN Systems and Tec
- Page 249 and 250: Report No. 6945 BBN Systems and Tec
- Page 251 and 252: Report No. 6945 BBN Systems and Tec
- Page 253 and 254: Report No. 6945 BBN Systems and Tec
- Page 255 and 256: Report No. 6945 BBN Systems and ~ec
- Page 257 and 258: Report No. 6945 BBN Systems and Tec
- Page 259 and 260: Report No. 6945 - BBN Systems and T
- Page 261 and 262: Report No. 6945 BBN Systems and Tec
- Page 263 and 264: Report No. 6945 BBN Systems and Tec
- Page 265 and 266: Report No. 6945 BBN Systems and Tec
- Page 267 and 268: Report No. 6945 BBN Systems and Tec
- Page 269 and 270: Report No. 6945 BBN Systems and Tec
- Page 271 and 272: Report No. 6945 BBN Systems and Tec
- Page 273 and 274: Report No. 6945 BBN Systems and Tec
- Page 275: Report No. 6945 BBN Systems and Tec
- Page 278 and 279: Report No. 6945 BBN Systems and Tec
- Page 280 and 281: Report No. 6945 FIG. C. 1 A BBN Sys
- Page 282 and 283: Report No. 6945 BBN Systems and Tec
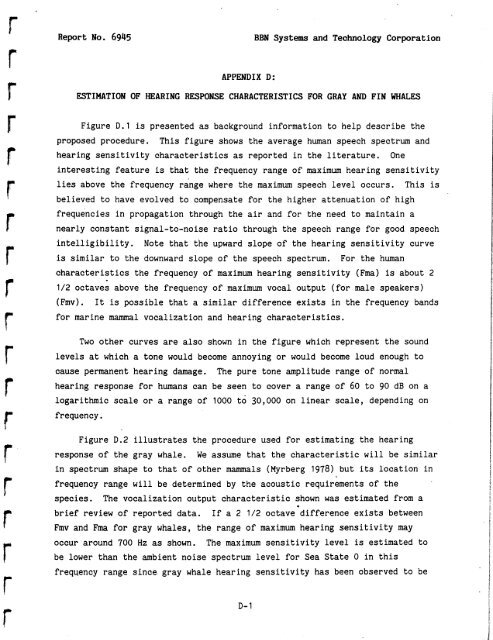
- Page 286 and 287: FIG. D. 1 HUMAN VOCALIZATION AND AU
- Page 288 and 289: FIG. D. 3 ESTIMATED HEARING CHARACT
- Page 290 and 291: Report No. 6945 BBN Systems and Tec
- Page 292 and 293: Report No. 6945 BBN Systems and Tec
- Page 294 and 295: Report No. 6945 BBN Systems and Tec
- Page 296 and 297: Report No. 6945 BBN Systems and Tec
- Page 298 and 299: Report No. 6945 BBN Systems and Tec
- Page 300 and 301: Report No. 6945 BBN Systems and Tec
- Page 302 and 303: Report No. 6945 BBN Systems and Tec
- Page 304: Report No. 6945 BBN Systems and Tec