

ASEAN: Regional Trends in Economic Integration, Export ... - USITC
ASEAN: Regional Trends in Economic Integration, Export ... - USITC
ASEAN: Regional Trends in Economic Integration, Export ... - USITC

Create successful ePaper yourself
Turn your PDF publications into a flip-book with our unique Google optimized e-Paper software.
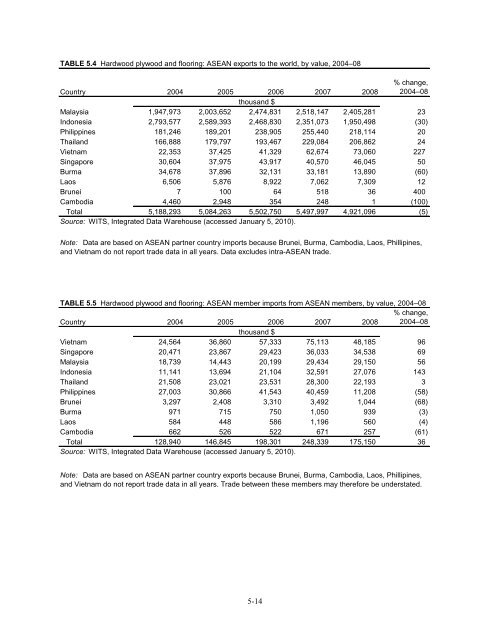
TABLE 5.4 Hardwood plywood and floor<strong>in</strong>g: <strong>ASEAN</strong> exports to the world, by value, 2004–08<br />
Country 2004 2005 2006 2007 2008<br />
% change,<br />
2004–08<br />
thousand $<br />
Malaysia 1,947,973 2,003,652 2,474,831 2,518,147 2,405,281 23<br />
Indonesia 2,793,577 2,589,393 2,468,830 2,351,073 1,950,498 (30)<br />
Philipp<strong>in</strong>es 181,246 189,201 238,905 255,440 218,114 20<br />
Thailand 166,888 179,797 193,467 229,084 206,862 24<br />
Vietnam 22,353 37,425 41,329 62,674 73,060 227<br />
S<strong>in</strong>gapore 30,604 37,975 43,917 40,570 46,045 50<br />
Burma 34,678 37,896 32,131 33,181 13,890 (60)<br />
Laos 6,506 5,876 8,922 7,062 7,309 12<br />
Brunei 7 100 64 518 36 400<br />
Cambodia 4,460 2,948 354 248 1 (100)<br />
Total 5,188,293 5,084,263 5,502,750 5,497,997 4,921,096 (5)<br />
Source: WITS, Integrated Data Warehouse (accessed January 5, 2010).<br />
Note: Data are based on <strong>ASEAN</strong> partner country imports because Brunei, Burma, Cambodia, Laos, Phillip<strong>in</strong>es,<br />
and Vietnam do not report trade data <strong>in</strong> all years. Data excludes <strong>in</strong>tra-<strong>ASEAN</strong> trade.<br />
TABLE 5.5 Hardwood plywood and floor<strong>in</strong>g: <strong>ASEAN</strong> member imports from <strong>ASEAN</strong> members, by value, 2004–08<br />
% change,<br />
Country 2004 2005 2006 2007 2008 2004–08<br />
thousand $<br />
Vietnam 24,564 36,860 57,333 75,113 48,185 96<br />
S<strong>in</strong>gapore 20,471 23,867 29,423 36,033 34,538 69<br />
Malaysia 18,739 14,443 20,199 29,434 29,150 56<br />
Indonesia 11,141 13,694 21,104 32,591 27,076 143<br />
Thailand 21,508 23,021 23,531 28,300 22,193 3<br />
Philipp<strong>in</strong>es 27,003 30,866 41,543 40,459 11,208 (58)<br />
Brunei 3,297 2,408 3,310 3,492 1,044 (68)<br />
Burma 971 715 750 1,050 939 (3)<br />
Laos 584 448 586 1,196 560 (4)<br />
Cambodia 662 526 522 671 257 (61)<br />
Total 128,940 146,845 198,301 248,339 175,150 36<br />
Source: WITS, Integrated Data Warehouse (accessed January 5, 2010).<br />
Note: Data are based on <strong>ASEAN</strong> partner country exports because Brunei, Burma, Cambodia, Laos, Phillip<strong>in</strong>es,<br />
and Vietnam do not report trade data <strong>in</strong> all years. Trade between these members may therefore be understated.<br />
5-14


