BSEP116B Biodiversity in the Baltic Sea - Helcom
BSEP116B Biodiversity in the Baltic Sea - Helcom
BSEP116B Biodiversity in the Baltic Sea - Helcom

You also want an ePaper? Increase the reach of your titles
YUMPU automatically turns print PDFs into web optimized ePapers that Google loves.
Average number of species<br />
20<br />
15<br />
10<br />
5<br />
0<br />
Arkona Bas<strong>in</strong><br />
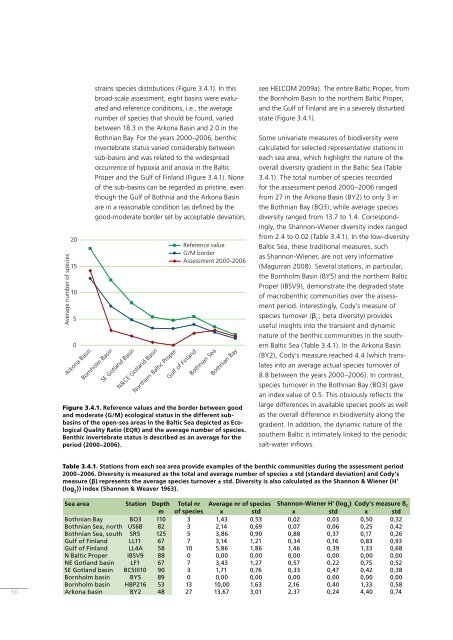
stra<strong>in</strong>s species distributions (Figure 3.4.1). In this<br />
broad-scale assessment, eight bas<strong>in</strong>s were evaluated<br />
and reference conditions, i.e., <strong>the</strong> average<br />
number of species that should be found, varied<br />
between 18.3 <strong>in</strong> <strong>the</strong> Arkona Bas<strong>in</strong> and 2.0 <strong>in</strong> <strong>the</strong><br />
Bothnian Bay. For <strong>the</strong> years 2000–2006, benthic<br />
<strong>in</strong>vertebrate status varied considerably between<br />
sub-bas<strong>in</strong>s and was related to <strong>the</strong> widespread<br />
occurrence of hypoxia and anoxia <strong>in</strong> <strong>the</strong> <strong>Baltic</strong><br />
Proper and <strong>the</strong> Gulf of F<strong>in</strong>land (Figure 3.4.1). None<br />
of <strong>the</strong> sub-bas<strong>in</strong>s can be regarded as prist<strong>in</strong>e, even<br />
though <strong>the</strong> Gulf of Bothnia and <strong>the</strong> Arkona Bas<strong>in</strong><br />
are <strong>in</strong> a reasonable condition (as def<strong>in</strong>ed by <strong>the</strong><br />
good-moderate border set by acceptable deviation;<br />
Bornholm Bas<strong>in</strong><br />
SE Gotland Bas<strong>in</strong><br />
N&CE Gotland Bas<strong>in</strong><br />
Nor<strong>the</strong>rn <strong>Baltic</strong> Proper<br />
Reference value<br />
G/M border<br />
Assessment 2000-2006<br />
Gulf of F<strong>in</strong>land<br />
Bothnian <strong>Sea</strong><br />
Bothnian Bay<br />
Figure 3.4.1. Reference values and <strong>the</strong> border between good<br />
and moderate (G/M) ecological status <strong>in</strong> <strong>the</strong> different subbas<strong>in</strong>s<br />
of <strong>the</strong> open-sea areas <strong>in</strong> <strong>the</strong> <strong>Baltic</strong> <strong>Sea</strong> depicted as Ecological<br />
Quality Ratio (EQR) and <strong>the</strong> average number of species.<br />
Benthic <strong>in</strong>vertebrate status is described as an average for <strong>the</strong><br />
period (2000–2006).<br />
see HELCOM 2009a). The entire <strong>Baltic</strong> Proper, from<br />
<strong>the</strong> Bornholm Bas<strong>in</strong> to <strong>the</strong> nor<strong>the</strong>rn <strong>Baltic</strong> Proper,<br />
and <strong>the</strong> Gulf of F<strong>in</strong>land are <strong>in</strong> a severely disturbed<br />
state (Figure 3.4.1).<br />
Some univariate measures of biodiversity were<br />
calculated for selected representative stations <strong>in</strong><br />
each sea area, which highlight <strong>the</strong> nature of <strong>the</strong><br />
overall diversity gradient <strong>in</strong> <strong>the</strong> <strong>Baltic</strong> <strong>Sea</strong> (Table<br />
3.4.1). The total number of species recorded<br />
for <strong>the</strong> assessment period 2000–2006 ranged<br />
from 27 <strong>in</strong> <strong>the</strong> Arkona Bas<strong>in</strong> (BY2) to only 3 <strong>in</strong><br />
<strong>the</strong> Bothnian Bay (BO3), while average species<br />
diversity ranged from 13.7 to 1.4. Correspond<strong>in</strong>gly,<br />
<strong>the</strong> Shannon-Wiener diversity <strong>in</strong>dex ranged<br />
from 2.4 to 0.02 (Table 3.4.1). In <strong>the</strong> low-diversity<br />
<strong>Baltic</strong> <strong>Sea</strong>, <strong>the</strong>se traditional measures, such<br />
as Shannon-Wiener, are not very <strong>in</strong>formative<br />
(Magurran 2008). Several stations, <strong>in</strong> particular,<br />
<strong>the</strong> Bornholm Bas<strong>in</strong> (BY5) and <strong>the</strong> nor<strong>the</strong>rn <strong>Baltic</strong><br />
Proper (IBSV9), demonstrate <strong>the</strong> degraded state<br />
of macrobenthic communities over <strong>the</strong> assessment<br />
period. Interest<strong>in</strong>gly, Cody’s measure of<br />
species turnover (β c<br />
; beta diversity) provides<br />
useful <strong>in</strong>sights <strong>in</strong>to <strong>the</strong> transient and dynamic<br />
nature of <strong>the</strong> benthic communities <strong>in</strong> <strong>the</strong> sou<strong>the</strong>rn<br />
<strong>Baltic</strong> <strong>Sea</strong> (Table 3.4.1). In <strong>the</strong> Arkona Bas<strong>in</strong><br />
(BY2), Cody’s measure reached 4.4 (which translates<br />
<strong>in</strong>to an average actual species turnover of<br />
8.8 between <strong>the</strong> years 2000–2006). In contrast,<br />
species turnover <strong>in</strong> <strong>the</strong> Bothnian Bay (BO3) gave<br />
an <strong>in</strong>dex value of 0.5. This obviously reflects <strong>the</strong><br />
large differences <strong>in</strong> available species pools as well<br />
as <strong>the</strong> overall difference <strong>in</strong> biodiversity along <strong>the</strong><br />
gradient. In addition, <strong>the</strong> dynamic nature of <strong>the</strong><br />
sou<strong>the</strong>rn <strong>Baltic</strong> is <strong>in</strong>timately l<strong>in</strong>ked to <strong>the</strong> periodic<br />
salt-water <strong>in</strong>flows.<br />
Table 3.4.1. Stations from each sea area provide examples of <strong>the</strong> benthic communities dur<strong>in</strong>g <strong>the</strong> assessment period<br />
2000–2006. Diversity is measured as <strong>the</strong> total and average number of species ± std (standard deviation) and Cody’s<br />
measure (β) represents <strong>the</strong> average species turnover ± std. Diversity is also calculated as <strong>the</strong> Shannon & Wiener (H’<br />
(log 2<br />
)) <strong>in</strong>dex (Shannon & Weaver 1963).<br />
50<br />
<strong>Sea</strong> area Station Depth Total nr Average nr of species Shannon-Wiener H' (log 2<br />
) Cody's measure ß C<br />
m of species x std x std x std<br />
Bothnian Bay BO3 110 3 1,43 0,53 0,02 0,03 0,50 0,32<br />
Bothnian <strong>Sea</strong>, north US6B 82 3 2,14 0,69 0,07 0,06 0,25 0,42<br />
Bothnian <strong>Sea</strong>, south SR5 125 5 3,86 0,90 0,88 0,37 0,17 0,26<br />
Gulf of F<strong>in</strong>land LL11 67 7 3,14 1,21 0,34 0,16 0,83 0,93<br />
Gulf of F<strong>in</strong>land LL4A 58 10 5,86 1,86 1,46 0,39 1,33 0,68<br />
N <strong>Baltic</strong> Proper IBSV9 88 0 0,00 0,00 0,00 0,00 0,00 0,00<br />
NE Gotland bas<strong>in</strong> LF1 67 7 3,43 1,27 0,57 0,22 0,75 0,52<br />
SE Gotland bas<strong>in</strong> BCSIII10 90 3 1,71 0,76 0,33 0,47 0,42 0,38<br />
Bornholm bas<strong>in</strong> BY5 89 0 0,00 0,00 0,00 0,00 0,00 0,00<br />
Bornholm bas<strong>in</strong> HBP216 53 13 10,00 1,63 2,16 0,40 1,33 0,58<br />
Arkona bas<strong>in</strong> BY2 48 27 13,67 3,01 2,37 0,24 4,40 0,74