

NEW_Accomplishments.indd - IRIS
NEW_Accomplishments.indd - IRIS
NEW_Accomplishments.indd - IRIS

You also want an ePaper? Increase the reach of your titles
YUMPU automatically turns print PDFs into web optimized ePapers that Google loves.
2006 <strong>IRIS</strong> 5-YEAR PROPOSAL SURFACE OF THE EARTH: GLOBAL STUDIES<br />
The Upper Mantle P Wave Structure Beneath Ethiopia and Kenya<br />
Yongcehol Park, Margaret H. Benoit, Andrew A. Nybalde • Pennsylvania State University<br />
Charles A. Langston • University of Memphis<br />
The origin of uplift and rifting and volcanism in East Africa is controversial, and has been commonly attributed to one or<br />
more mantle plumes. To examine upper mantle structure beneath Ethiopia and the Kenya rift, we have modeled the P- wave<br />
velocity variations by inverting travel time residuals from teleseismic earthquakes recorded by the 2000-2002 Ethiopia Broadband<br />
Seismic Experiment, the 2001-2002 Kenya Broadband Seismic Experiment, the KRISP85 and KRISP90 experiment, and<br />
permanent stations ATD, FURI, and KMBO. The P model for Ethiopia shows strong velocity variations between 150 and 400<br />
km depth. At 150 km depth, the low velocity region is centered beneath the Afar Depression, Main Ethiopian rift, and slightly<br />
west of the rift under the western portion of the Ethiopia Plateau. Deeper in the models (200 – 400 km depth), the center of<br />
the low-velocity structure appears to shift westward a cross the Western Ethiopian Plateau, offset from the strike of the Main<br />
Ethiopian rift. Additionally, the model reveals faster-than-average velocities beneath the Eastern Ethiopia Plateau and the<br />
northwest section of Western Ethiopian Plateau. The model obtained for Kenya shows a strong low-velocity region beneath the<br />
Kenya rift that shifts to the west with depth. In spite of the limited resolution, it is apparent that the thermally-perturbed upper<br />
mantle structure extends to depths in excess of 300 km, and dips to the west beneath the Tanzania Craton.<br />
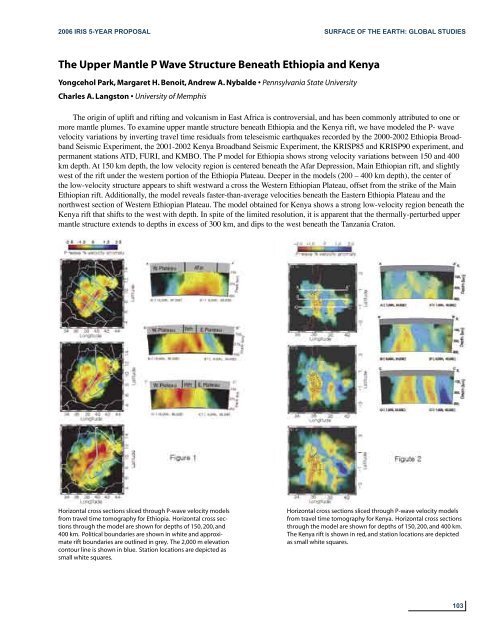
Horizontal cross sections sliced through P-wave velocity models<br />
from travel time tomography for Ethiopia. Horizontal cross sections<br />
through the model are shown for depths of 150, 200, and<br />
400 km. Political boundaries are shown in white and approximate<br />
rift boundaries are outlined in grey. The 2,000 m elevation<br />
contour line is shown in blue. Station locations are depicted as<br />
small white squares.<br />
Horizontal cross sections sliced through P-wave velocity models<br />
from travel time tomography for Kenya. Horizontal cross sections<br />
through the model are shown for depths of 150, 200, and 400 km.<br />
The Kenya rift is shown in red, and station locations are depicted<br />
as small white squares.<br />
103


