

NEW_Accomplishments.indd - IRIS
NEW_Accomplishments.indd - IRIS
NEW_Accomplishments.indd - IRIS

You also want an ePaper? Increase the reach of your titles
YUMPU automatically turns print PDFs into web optimized ePapers that Google loves.
CORE–MANTLE BOUNDARY<br />
2006 <strong>IRIS</strong> 5-YEAR PROPOSAL<br />
Sharp Lateral Boundaries in the D” Region<br />
Akiko To, Barbara Romanowicz, Yann Capdeville • University of California, Berkeley<br />
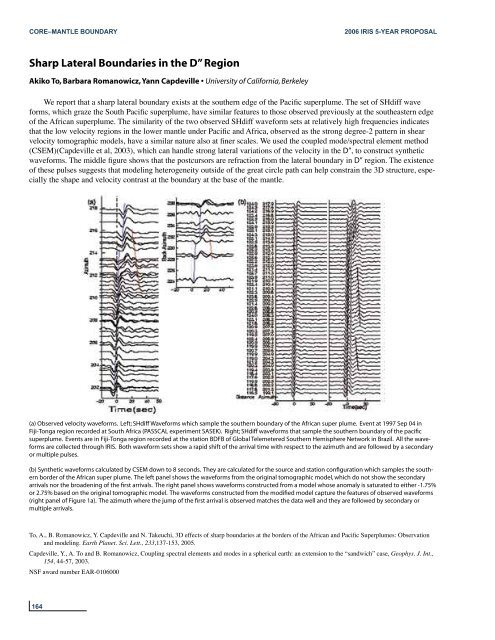
We report that a sharp lateral boundary exists at the southern edge of the Pacific superplume. The set of SHdiff wave<br />
forms, which graze the South Pacific superplume, have similar features to those observed previously at the southeastern edge<br />
of the African superplume. The similarity of the two observed SHdiff waveform sets at relatively high frequencies indicates<br />
that the low velocity regions in the lower mantle under Pacific and Africa, observed as the strong degree-2 pattern in shear<br />
velocity tomographic models, have a similar nature also at finer scales. We used the coupled mode/spectral element method<br />
(CSEM)(Capdeville et al, 2003), which can handle strong lateral variations of the velocity in the D”, to construct synthetic<br />
waveforms. The middle figure shows that the postcursors are refraction from the lateral boundary in D” region. The existence<br />
of these pulses suggests that modeling heterogeneity outside of the great circle path can help constrain the 3D structure, especially<br />
the shape and velocity contrast at the boundary at the base of the mantle.<br />
(a) Observed velocity waveforms. Left; SHdiff Waveforms which sample the southern boundary of the African super plume. Event at 1997 Sep 04 in<br />
Fiji-Tonga region recorded at South Africa (PASSCAL experiment SASEK). Right; SHdiff waveforms that sample the southern boundary of the pacific<br />
superplume. Events are in Fiji-Tonga region recorded at the station BDFB of Global Telemetered Southern Hemisphere Network in Brazil. All the waveforms<br />
are collected through <strong>IRIS</strong>. Both waveform sets show a rapid shift of the arrival time with respect to the azimuth and are followed by a secondary<br />
or multiple pulses.<br />
(b) Synthetic waveforms calculated by CSEM down to 8 seconds. They are calculated for the source and station configuration which samples the southern<br />
border of the African super plume. The left panel shows the waveforms from the original tomographic model, which do not show the secondary<br />
arrivals nor the broadening of the first arrivals. The right panel shows waveforms constructed from a model whose anomaly is saturated to either -1.75%<br />
or 2.75% based on the original tomographic model. The waveforms constructed from the modified model capture the features of observed waveforms<br />
(right panel of Figure 1a). The azimuth where the jump of the first arrival is observed matches the data well and they are followed by secondary or<br />
multiple arrivals.<br />
To, A., B. Romanowicz, Y. Capdeville and N. Takeuchi, 3D effects of sharp boundaries at the borders of the African and Pacific Superplumes: Observation<br />
and modeling. Earth Planet. Sci. Lett., 233,137-153, 2005.<br />
Capdeville, Y., A. To and B. Romanowicz, Coupling spectral elements and modes in a spherical earth: an extension to the “sandwich” case, Geophys. J. Int.,<br />
154, 44-57, 2003.<br />
NSF award number EAR-0106000<br />
164


