

NEW_Accomplishments.indd - IRIS
NEW_Accomplishments.indd - IRIS
NEW_Accomplishments.indd - IRIS

You also want an ePaper? Increase the reach of your titles
YUMPU automatically turns print PDFs into web optimized ePapers that Google loves.
2006 <strong>IRIS</strong> 5-YEAR PROPOSAL SURFACE OF THE EARTH: GLOBAL STUDIES<br />
Small-Scale Variations in Seismic Anisotropy Near Kimberley, South Africa<br />
Matthew J. Fouch, David R. Bell • Arizona State University<br />
Paul G. Silver • Carnegie Institution of Washington<br />
Jean N. Lee • Harvard University<br />
Using broadband seismic data from the <strong>IRIS</strong> PASSCAL broadband telemetered<br />
array installed near Kimberley, South Africa, we place new constraints on seismic<br />
anisotropy in an area of extensive mantle modification within an Archean cratonic<br />
setting (Fouch et al., 2004). The array was installed as part of the multidisciplinary<br />
Kaapvaal Project, which extensively studied the region via petrologic, geochemical,<br />
and seismic means, and provided a unique opportunity to meld the results of a broad<br />
range of datasets to examine processes of cratonic evolution.<br />
Splitting time (sec)<br />
0.9<br />
0.8<br />
0.7<br />
0.6<br />
0.5<br />
0.4<br />
0.3<br />
0.2<br />
0.1<br />
0.0<br />
A<br />
-35 -30 -25 -20 -15 -10 -5 0 5 10 15 20 25 30 35<br />
Projected distance from array center (km)<br />
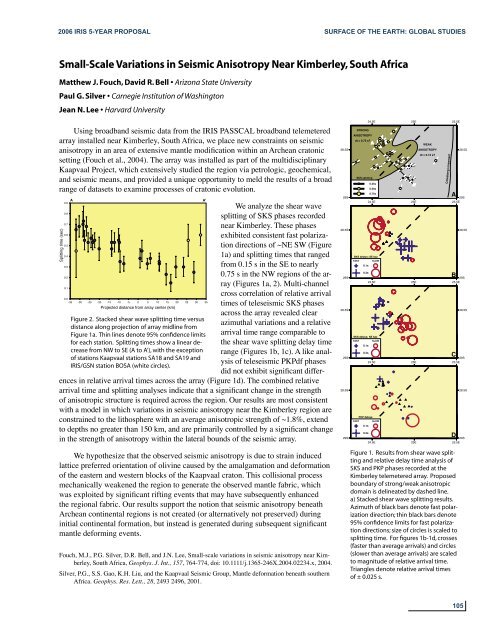
Figure 2. Stacked shear wave splitting time versus<br />
distance along projection of array midline from<br />
Figure 1a. Thin lines denote 95% confidence limits<br />
for each station. Splitting times show a linear decrease<br />
from NW to SE (A to A’), with the exception<br />
of stations Kaapvaal stations SA18 and SA19 and<br />
<strong>IRIS</strong>/GSN station BOSA (white circles).<br />
We analyze the shear wave<br />
splitting of SKS phases recorded<br />
near Kimberley. These phases<br />
exhibited consistent fast polarization<br />
directions of ~NE SW (Figure<br />
1a) and splitting times that ranged<br />
from 0.15 s in the SE to nearly<br />
0.75 s in the NW regions of the array<br />
(Figures 1a, 2). Multi-channel<br />
cross correlation of relative arrival<br />
times of teleseismic SKS phases<br />
across the array revealed clear<br />
azimuthal variations and a relative<br />
arrival time range comparable to<br />
the shear wave splitting delay time<br />
range (Figures 1b, 1c). A like analysis<br />
of teleseismic PKPdf phases<br />
did not exhibit significant differences<br />
in relative arrival times across the array (Figure 1d). The combined relative<br />
arrival time and splitting analyses indicate that a significant change in the strength<br />
of anisotropic structure is required across the region. Our results are most consistent<br />
with a model in which variations in seismic anisotropy near the Kimberley region are<br />
constrained to the lithosphere with an average anisotropic strength of ~1.8%, extend<br />
to depths no greater than 150 km, and are primarily controlled by a significant change<br />
in the strength of anisotropy within the lateral bounds of the seismic array.<br />
We hypothesize that the observed seismic anisotropy is due to strain induced<br />
lattice preferred orientation of olivine caused by the amalgamation and deformation<br />
of the eastern and western blocks of the Kaapvaal craton. This collisional process<br />
mechanically weakened the region to generate the observed mantle fabric, which<br />
was exploited by significant rifting events that may have subsequently enhanced<br />
the regional fabric. Our results support the notion that seismic anisotropy beneath<br />
Archean continental regions is not created (or alternatively not preserved) during<br />
initial continental formation, but instead is generated during subsequent significant<br />
mantle deforming events.<br />
Fouch, M.J., P.G. Silver, D.R. Bell, and J.N. Lee, Small-scale variations in seismic anisotropy near Kimberley,<br />
South Africa, Geophys. J. Int., 157, 764-774, doi: 10.1111/j.1365-246X.2004.02234.x, 2004.<br />
Silver, P.G., S.S. Gao, K.H. Liu, and the Kaapvaal Seismic Group, Mantle deformation beneath southern<br />
Africa. Geophys. Res. Lett., 28, 2493 2496, 2001.<br />
A'<br />
29S<br />
29S<br />
24.5E<br />
24.5E<br />
Figure 1. Results from shear wave splitting<br />
and relative delay time analysis of<br />
SKS and PKP phases recorded at the<br />
Kimberley telemetered array. Proposed<br />
boundary of strong/weak anisotropic<br />
domain is delineated by dashed line.<br />
a) Stacked shear wave splitting results.<br />
Azimuth of black bars denote fast polarization<br />
direction; thin black bars denote<br />
95% confidence limits for fast polarization<br />
directions; size of circles is scaled to<br />
splitting time. For figures 1b-1d, crosses<br />
(faster than average arrivals) and circles<br />
(slower than average arrivals) are scaled<br />
to magnitude of relative arrival time.<br />
Triangles denote relative arrival times<br />
of ± 0.025 s.<br />
25E<br />
25E<br />
25.5E<br />
28.5S 28.5S<br />
29S<br />
SKS delays; SE baz<br />
FAST<br />
0.1 s<br />
0.2 s<br />
SLOW<br />
25.5E<br />
28.5S 28.5S<br />
29S<br />
dt = 0.75 s?<br />
A<br />
SKS delays; NE baz<br />
FAST<br />
0.1 s<br />
0.2 s<br />
SLOW<br />
24.5E 25E 25.5E<br />
28.5S 28.5S<br />
FAST<br />
STRONG<br />
ANISOTROPY<br />
PKP delays<br />
0.1 s<br />
0.2 s<br />
24.5E 25E 25.5E<br />
28.5S ANISOTROPY<br />
28.5S<br />
SKS splitting<br />
0.25s<br />
s<br />
0.50s<br />
s<br />
0.75s<br />
SLOW<br />
A'<br />
WEAK<br />
dt = 0.15 s?<br />
24.5E 25E 25.5E<br />
Colesberg Lineament<br />
A<br />
B<br />
C<br />
D<br />
29S<br />
29S<br />
29S<br />
29S<br />
105


