

NEW_Accomplishments.indd - IRIS
NEW_Accomplishments.indd - IRIS
NEW_Accomplishments.indd - IRIS

Create successful ePaper yourself
Turn your PDF publications into a flip-book with our unique Google optimized e-Paper software.
2006 <strong>IRIS</strong> 5-YEAR PROPOSAL MONITORING OTHER SEISMIC SOURCES<br />
Ambient Seismic Noise Monitoring in North-Central Illinois<br />
Philip J. Carpenter • Northern Illinois University<br />
Seismic noise monitoring and analysis were conducted as part of a study to evaluate the feasibility of building a new<br />
linear collider in northern Illinois, in close proximity to the Fermi National Accelerator Laboratory, just west of Chicago. The<br />
Seismic Analysis Code 2000 (SAC2000), free to <strong>IRIS</strong> members, was used to process data recorded at the Northern Illinois<br />
University seismic station, earthquake records downloaded from the <strong>IRIS</strong> Data Management Center via WILBERII, and data<br />
recorded by an engineering seismograph with high-frequency geophones. Power-spectral density estimates were computed<br />
from an autocorrelation series in most cases. Using the power density spectra routine of SAC2000, selecting autocorrelation<br />
windows of 20 s for the low-frequency data and 2 s for the high-frequency data, we have found distinctive seismic noise<br />
peaks among the different sites, regardless of the background noise level (e.g., Figure 1). Low-frequency waveform data<br />
typically shows microseism peaks at a frequency of 0.05-0.2 Hz for stations located in the Midwestern U.S. Microseism peak<br />
frequency did not decrease with increasing distance from Lake Michigan, suggesting the lake is not the primary source of the<br />
microseisms, which may be generated in ocean basins. To investigate local ground motion in more detail, noise from trains,<br />
traffic, air-conditioning units and water pumping equipment were recorded with an engineering seismograph in DeKalb,<br />
Illinois, using both vertical and horizontal geophones. These data were also analyzed using SAC2000. Train noise exhibits<br />
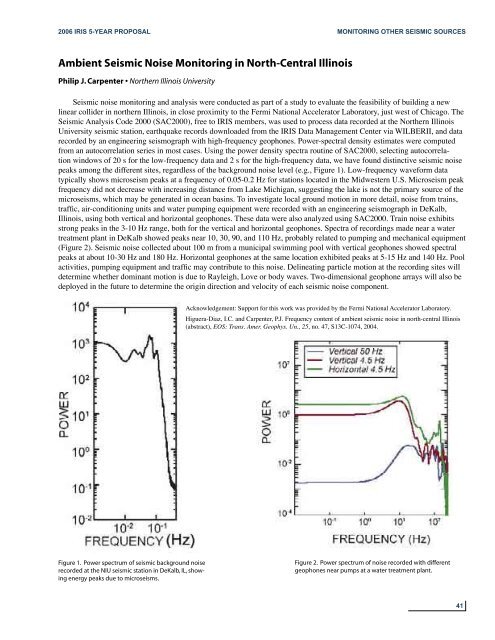
strong peaks in the 3-10 Hz range, both for the vertical and horizontal geophones. Spectra of recordings made near a water<br />
treatment plant in DeKalb showed peaks near 10, 30, 90, and 110 Hz, probably related to pumping and mechanical equipment<br />
(Figure 2). Seismic noise collected about 100 m from a municipal swimming pool with vertical geophones showed spectral<br />
peaks at about 10-30 Hz and 180 Hz. Horizontal geophones at the same location exhibited peaks at 5-15 Hz and 140 Hz. Pool<br />
activities, pumping equipment and traffic may contribute to this noise. Delineating particle motion at the recording sites will<br />
determine whether dominant motion is due to Rayleigh, Love or body waves. Two-dimensional geophone arrays will also be<br />
deployed in the future to determine the origin direction and velocity of each seismic noise component.<br />
Acknowledgement: Support for this work was provided by the Fermi National Accelerator Laboratory.<br />
Higuera-Diaz, I.C. and Carpenter, P.J. Frequency content of ambient seismic noise in north-central Illinois<br />
(abstract), EOS: Trans. Amer. Geophys. Un., 25, no. 47, S13C-1074, 2004.<br />
Figure 1. Power spectrum of seismic background noise<br />
recorded at the NIU seismic station in DeKalb, IL, showing<br />
energy peaks due to microseisms.<br />
Figure 2. Power spectrum of noise recorded with different<br />
geophones near pumps at a water treatment plant.<br />
41


