

NEW_Accomplishments.indd - IRIS
NEW_Accomplishments.indd - IRIS
NEW_Accomplishments.indd - IRIS

You also want an ePaper? Increase the reach of your titles
YUMPU automatically turns print PDFs into web optimized ePapers that Google loves.
2006 <strong>IRIS</strong> 5-YEAR PROPOSAL EARTHQUAKES<br />
Rapid Imaging of Large Earthquake Rupture Zones with P waves: Application to<br />
the 28 March 2005 Sumatra M w 8.7 Earthquake Suggests Bilateral Rupture<br />
Kris Walker, Miaki Ishii, Peter Shearer • University of California, San Diego<br />
Paul Earle • U.S. Geological Survey<br />
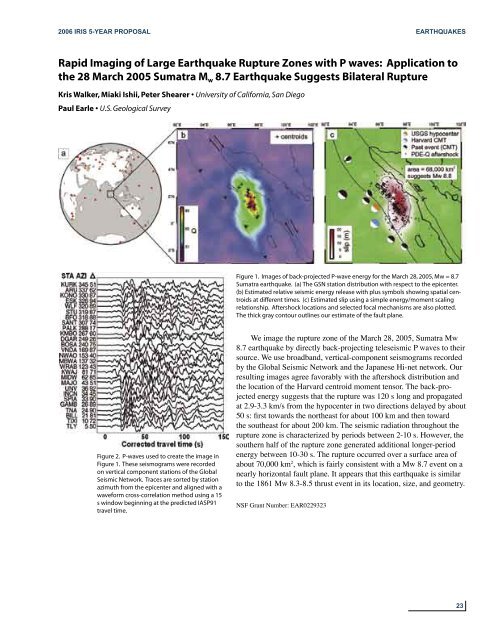
Figure 1. Images of back-projected P-wave energy for the March 28, 2005, Mw = 8.7<br />
Sumatra earthquake. (a) The GSN station distribution with respect to the epicenter.<br />
(b) Estimated relative seismic energy release with plus symbols showing spatial centroids<br />
at different times. (c) Estimated slip using a simple energy/moment scaling<br />
relationship. Aftershock locations and selected focal mechanisms are also plotted.<br />
The thick gray contour outlines our estimate of the fault plane.<br />
Figure 2. P-waves used to create the image in<br />
Figure 1. These seismograms were recorded<br />
on vertical component stations of the Global<br />
Seismic Network. Traces are sorted by station<br />
azimuth from the epicenter and aligned with a<br />
waveform cross-correlation method using a 15<br />
s window beginning at the predicted IASP91<br />
travel time.<br />
We image the rupture zone of the March 28, 2005, Sumatra Mw<br />
8.7 earthquake by directly back-projecting teleseismic P waves to their<br />
source. We use broadband, vertical-component seismograms recorded<br />
by the Global Seismic Network and the Japanese Hi-net network. Our<br />
resulting images agree favorably with the aftershock distribution and<br />
the location of the Harvard centroid moment tensor. The back-projected<br />
energy suggests that the rupture was 120 s long and propagated<br />
at 2.9-3.3 km/s from the hypocenter in two directions delayed by about<br />
50 s: first towards the northeast for about 100 km and then toward<br />
the southeast for about 200 km. The seismic radiation throughout the<br />
rupture zone is characterized by periods between 2-10 s. However, the<br />
southern half of the rupture zone generated additional longer-period<br />
energy between 10-30 s. The rupture occurred over a surface area of<br />
about 70,000 km 2 , which is fairly consistent with a Mw 8.7 event on a<br />
nearly horizontal fault plane. It appears that this earthquake is similar<br />
to the 1861 Mw 8.3-8.5 thrust event in its location, size, and geometry.<br />
NSF Grant Number: EAR0229323<br />
23


