

NEW_Accomplishments.indd - IRIS
NEW_Accomplishments.indd - IRIS
NEW_Accomplishments.indd - IRIS

Create successful ePaper yourself
Turn your PDF publications into a flip-book with our unique Google optimized e-Paper software.
SURFACE OF THE EARTH: GLOBAL STUDIES<br />
2006 <strong>IRIS</strong> 5-YEAR PROPOSAL<br />
Seismically Imaging the East Antarctica/West Antarctica Boundary with TAMSEIS<br />
Jesse Lawrence, Douglas Wiens, Patrick Shore • Washington University<br />
Andrew Nyblade, Sridhar Anandakrishnan, Donald Voight • Pennsylvania State University<br />
The Transantarctic Mountain Seismic Experiment (TAMSEIS) provided (data to calculate) receiver functions, surface<br />
wave phase velocities, and differential S-wave attenuation measurements for parts of the West Antarctica Rift System<br />
(WARS), the Transantarctic Mountains (TAMs), and East Antarctica (EA). The 41 broadband seismometers deployed as part<br />
of TAMSEIS provided new insight into the differences between the WARS, the TAMs, and EA crust and mantle. Combined<br />
receiver function and phase velocity inversion with niching genetic algorithms produced accurate crustal and upper-most<br />
mantle seismic velocity models (Figure 1). The crustal thickness increases from 20 ± 2 km in the WARS to a maximum of<br />
40 ± 2 km beneath the crest of the TAMs at 110 ± 10 km inland. Farther inland, the crust of EA is uniformly 35 ± 3 km thick<br />
over a lateral distance greater than 1300 km. A temperature increase of ~300°C and density decrease of ~1% beneath WA<br />
are indicated by high phase velocities and low attenuation beneath EA and low velocities with high attenuation beneath. The<br />
transition between East and West Antarctica occurs 100 ± 50 km inland from the Ross Sea.<br />
The seismically inferred density profile agrees remarkably well with observed gravity and topography anomalies measured<br />
by airborne geophysical surveys. The positively buoyant thermal and erosional loads found in the TAMs are sufficient<br />
to cause the observed pattern of asymmetric slump blocks through flexural uplift (Figure 2).<br />
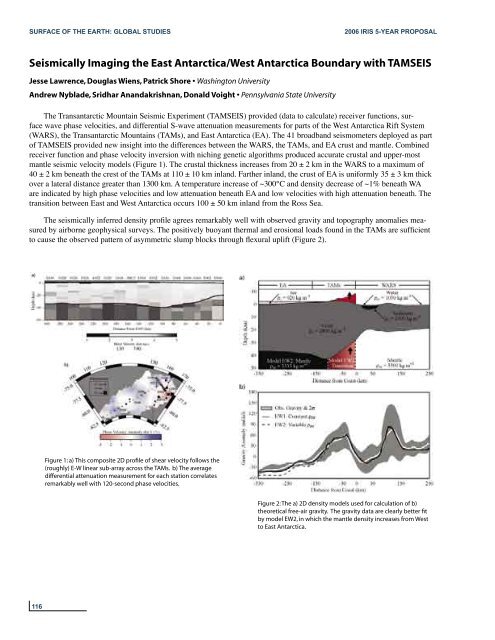
Figure 1: a) This composite 2D profile of shear velocity follows the<br />
(roughly) E-W linear sub-array across the TAMs. b) The average<br />
differential attenuation measurement for each station correlates<br />
remarkably well with 120-second phase velocities.<br />
Figure 2: The a) 2D density models used for calculation of b)<br />
theoretical free-air gravity. The gravity data are clearly better fit<br />
by model EW2, in which the mantle density increases from West<br />
to East Antarctica.<br />
116


