

NEW_Accomplishments.indd - IRIS
NEW_Accomplishments.indd - IRIS
NEW_Accomplishments.indd - IRIS

Create successful ePaper yourself
Turn your PDF publications into a flip-book with our unique Google optimized e-Paper software.
2006 <strong>IRIS</strong> 5-YEAR PROPOSAL SURFACE OF THE EARTH: GLOBAL STUDIES<br />
S-Wave Velocity Structure Beneath the KAAPVAAL Craton<br />
Angela Marie Larson, J. Arthur Snoke • Virginia Polytechnic Institute<br />
David E. James • Carnegie Institution of Washington<br />
Two-station Rayleigh-wave inversions for pure paths across the Kaapvaal craton of southern Africa yield velocity-depth<br />
profiles consistent with seismic estimates obtained from approximately 100 mantle xenoliths brought to the surface in kimberlite<br />
pipes. The cratonic xenoliths, all from the undisturbed region of the southern Kaapvaal craton and all less than 100 Ma in age,<br />
had been previously analyzed thermobarometrically to obtain an equilibrium P-T profile of the cratonic mantle to about 180 km<br />
depth. We use the seismic velocity-depth and density-depth profiles calculated on the basis of these P-T data and the mineral<br />
modes and compositions of the xenoliths (James et al., 2004) to generate starting models for the inversion. The seismic velocity<br />
and density-depth profiles from xenolith data are merged via smooth joins with those of the PREM global model for depths<br />
of 220 km and greater. The inversion is based on a composite of 16 pure-path fundamental-mode Rayleigh-wave dispersion<br />
curves from five events (Figure 1) across the southern Kaapvaal craton as shown in Figure 2A (Larson et al., 2005). The S-wave<br />
velocity-depth models differ only slightly from the velocity-depth models estimated from mantle xenoliths (see Figure 2 and<br />
caption for further explanation). S-wave velocities beneath the craton decrease slowly with depth to about 4.6 km/s at 200 km,<br />
but never approach values that could be considered asthenospheric (i.e. 4.3–4.4<br />
km/s). These results are consistent with other studies of cratonic areas showing<br />
that low velocity zones tend to be very weak. Moreover, the fact that the surface<br />
wave results are consistent with predictions from the xenolith data is a strong<br />
indication that the velocity structure (i.e. thermal structure) of the upper 180 km<br />
of the mantle beneath the Kaapvaal craton has not significantly changed over<br />
the past 100 million years.<br />
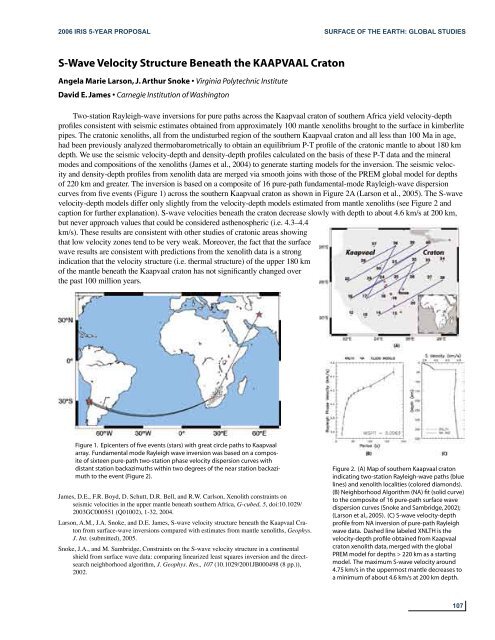
Figure 1. Epicenters of five events (stars) with great circle paths to Kaapvaal<br />
array. Fundamental mode Rayleigh wave inversion was based on a composite<br />
of sixteen pure-path two-station phase velocity dispersion curves with<br />
distant station backazimuths within two degrees of the near station backazimuth<br />
to the event (Figure 2).<br />
James, D.E., F.R. Boyd, D. Schutt, D.R. Bell, and R.W. Carlson, Xenolith constraints on<br />
seismic velocities in the upper mantle beneath southern Africa, G-cubed, 5, doi:10.1029/<br />
2003GC000551 (Q01002), 1-32, 2004.<br />
Larson, A.M., J.A. Snoke, and D.E. James, S-wave velocity structure beneath the Kaapvaal Craton<br />
from surface-wave inversions compared with estimates from mantle xenoliths, Geophys.<br />
J. Int. (submitted), 2005.<br />
Snoke, J.A., and M. Sambridge, Constraints on the S-wave velocity structure in a continental<br />
shield from surface wave data: comparing linearized least squares inversion and the directsearch<br />
neighborhood algorithm, J. Geophys. Res., 107 (10.1029/2001JB000498 (8 pp.)),<br />
2002.<br />
Figure 2. (A) Map of southern Kaapvaal craton<br />
indicating two-station Rayleigh-wave paths (blue<br />
lines) and xenolith localities (colored diamonds).<br />
(B) Neighborhood Algorithm (NA) fit (solid curve)<br />
to the composite of 16 pure-path surface wave<br />
dispersion curves (Snoke and Sambridge, 2002);<br />
(Larson et al., 2005). (C) S-wave velocity-depth<br />
profile from NA inversion of pure-path Rayleigh<br />
wave data. Dashed line labeled XNLTH is the<br />
velocity-depth profile obtained from Kaapvaal<br />
craton xenolith data, merged with the global<br />
PREM model for depths > 220 km as a starting<br />
model. The maximum S-wave velocity around<br />
4.75 km/s in the uppermost mantle decreases to<br />
a minimum of about 4.6 km/s at 200 km depth.<br />
107


