

NEW_Accomplishments.indd - IRIS
NEW_Accomplishments.indd - IRIS
NEW_Accomplishments.indd - IRIS

Create successful ePaper yourself
Turn your PDF publications into a flip-book with our unique Google optimized e-Paper software.
2006 <strong>IRIS</strong> 5-YEAR PROPOSAL SURFACE OF THE EARTH: NORTH AMERICA<br />
Imaging the Fine Structure of the San Andreas Fault at Seismogenic Depths Using<br />
an Archived PASSCAL Dataset<br />
Jeff McGuire • Woods Hole Oceanographic Institution<br />
Yehuda Ben-Zion • University of Southern California<br />
Detailed imaging of fault-zone material properties at seismogenic depths is a difficult seismological problem owing to<br />
the short length scales of the structural features. Seismic energy trapped within a low-velocity damage zone has been utilized<br />
to image the fault core at shallow depths, but these phases appear to lack sensitivity to structure in the depth range where<br />
earthquakes nucleate. Major faults that juxtapose rocks of significantly different elastic properties generate a related phase<br />
termed a fault-zone head wave that spends the majority of its path refracting along the fault. We utilize data from a dense<br />
temporary PASSCAL array of seismometers in the Bear Valley region of the San Andreas Fault to demonstrate that head<br />
waves have sensitivity to fault-zone structure throughout the seismogenic zone. Measured differential arrival times between<br />
the head waves and direct P arrivals and waveform modeling of these phases provide high-resolution information on the<br />
velocity contrast across the fault. The obtained values document along-strike, fault-normal, and downdip variations in the<br />
strength of the velocity contrast, ranging from 20 to 50% depending on the regions being averaged by the ray paths. The complexity<br />
of the fault-zone waveforms increases dramatically in a region of the fault that has two active strands producing two<br />
separate bands of seismicity. Synthetic waveform calculations indicate that geological observations of the thickness and rocktype<br />
(granite) of the layer between the two strands are valid also for the subsurface structure of the fault. The results show<br />
that joint analysis of fault zone head waves and direct P arrivals can resolve important small scale elements of the fault zone<br />
<br />
ruptures is necessary for evaluating theoretical predictions of the effects that these structures have on rupture propagation.<br />
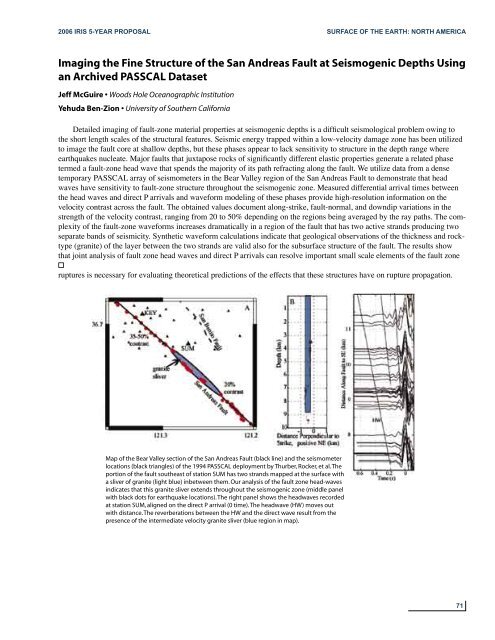
Map of the Bear Valley section of the San Andreas Fault (black line) and the seismometer<br />
locations (black triangles) of the 1994 PASSCAL deployment by Thurber, Rocker, et al. The<br />
portion of the fault southeast of station SUM has two strands mapped at the surface with<br />
a sliver of granite (light blue) inbetween them. Our analysis of the fault zone head-waves<br />
indicates that this granite sliver extends throughout the seismogenic zone (middle panel<br />
with black dots for earthquake locations). The right panel shows the headwaves recorded<br />
at station SUM, aligned on the direct P arrival (0 time). The headwave (HW) moves out<br />
with distance. The reverberations between the HW and the direct wave result from the<br />
presence of the intermediate velocity granite sliver (blue region in map).<br />
71


