

NEW_Accomplishments.indd - IRIS
NEW_Accomplishments.indd - IRIS
NEW_Accomplishments.indd - IRIS

You also want an ePaper? Increase the reach of your titles
YUMPU automatically turns print PDFs into web optimized ePapers that Google loves.
UPWELLING AND DOWNWELLING<br />
2006 <strong>IRIS</strong> 5-YEAR PROPOSAL<br />
Observations of Shear Wave Birefringence in Subduction Zones:<br />
A Guide to Mantle Flow?<br />
Vadim Levin • Rutgers University<br />
Valerie Peyton • U.S. Geological Survey, Albuquerque<br />
Jeffrey Park • Yale University<br />
Holly Bender, William Menke • LDEO<br />
In Earthʼs upper mantle the deformation of olivine crystals should lead to directional dependence of seismic wave speed,<br />
offering a way to map patterns of mantle flow through the study of anisotropy indicators in seismic waves. For example, the<br />
birefringence in core-refracted teleseismic shear waves (SKS) in two regions of the northwestern Pacific were studied using<br />
data from GSN stations ADK and PET, and a PASSCAL deployment on Kamchatka (1998-1999 SEKS campaign).<br />
At Adak island in the central Aleutians the fast polarization of shear waves is closely aligned with oblique convergence<br />
between Pacific and North American plates (right plot). In Kamchatka, areas underlain by the subducting Pacific plate show<br />
fast polarization direction orthogonal to the near-normal convergence between North America and Pacific plates. In both<br />
cases the anisotropic signal is strong enough to require upper mantle involvement. The dramatic difference in the relationship<br />
between the geodynamic regime and the pattern of anisotropy indicators suggests that the “mapping” of the latter into the<br />
former involves extra complexity that we do not fully understand at the moment.<br />
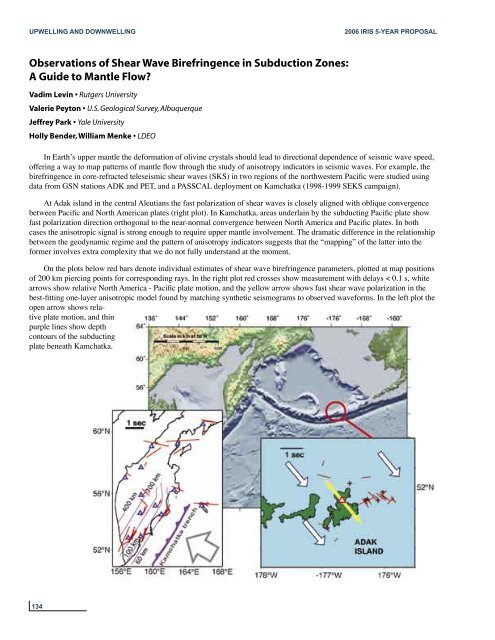
On the plots below red bars denote individual estimates of shear wave birefringence parameters, plotted at map positions<br />
of 200 km piercing points for corresponding rays. In the right plot red crosses show measurement with delays < 0.1 s, white<br />
arrows show relative North America - Pacific plate motion, and the yellow arrow shows fast shear wave polarization in the<br />
best-fitting one-layer anisotropic model found by matching synthetic seismograms to observed waveforms. In the left plot the<br />
open arrow shows relative<br />
plate motion, and thin<br />
purple lines show depth<br />
contours of the subducting<br />
plate beneath Kamchatka.<br />
134


