

NEW_Accomplishments.indd - IRIS
NEW_Accomplishments.indd - IRIS
NEW_Accomplishments.indd - IRIS

Create successful ePaper yourself
Turn your PDF publications into a flip-book with our unique Google optimized e-Paper software.
2006 <strong>IRIS</strong> 5-YEAR PROPOSAL GLOBAL MANTLE STRUCTURE<br />
Probing the Earth’s Interior by Stacking Stacked Short-Period Seismic Array Data<br />
Sebastian Rost, Michael Thorne • Arizona State University<br />
The short-period teleseismic wave field contains a great deal of information about the small-scale structure of Earthʼs<br />
interior. Due to the low signal-to-noise ratio of short-period arrivals, it is challenging to use this information in global seismological<br />
studies. Seismological arrays and networks can be used to increase the signal-to-noise ratio of seismic arrivals.<br />
By stacking seismic traces that are recorded at an array, the coherent part of the seismic wave field can be enhanced while<br />
suppressing incoherent noise. One array processing method often used is Nth-root slant-stacking. The result of this stacking<br />
method shows seismic energy as slowness (incidence angle) v. time (a vespagram). This enables the identification of coherent<br />
arrivals by travel-time and slowness that otherwise might be below the noise level.<br />
We use the information from a large number of vespagrams to map the short-period vertical seismic wave field. Approximately<br />
500 recordings from the small aperture Yellowknife array (YKA) located in northern Canada were used to calculate<br />
vespagrams. Data were obtained through the NetDC from <strong>IRIS</strong>. In order to use the information from the vespagrams we condense<br />
the information from slowness-time space into a new, multidimensional time-series, by moving a sliding time window<br />
across the vespagrams. The highest stacked energy in the time window (i.e. the stack for the slowness that yields the highest<br />
amplitude), is used to construct a new time series. From the vespagram we are able to obtain information about traveltime,<br />
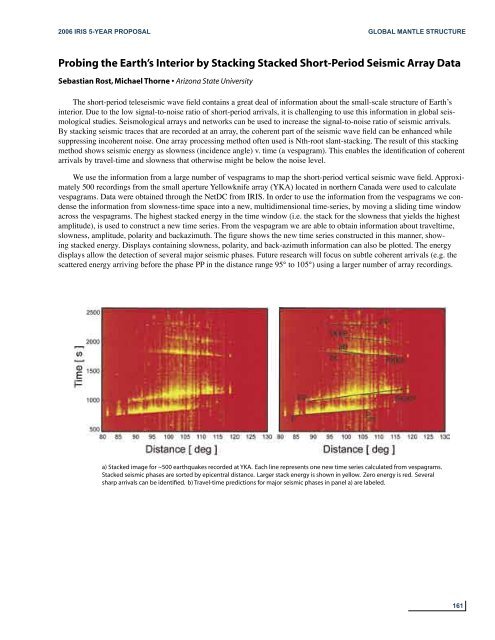
slowness, amplitude, polarity and backazimuth. The figure shows the new time series constructed in this manner, showing<br />
stacked energy. Displays containing slowness, polarity, and back-azimuth information can also be plotted. The energy<br />
displays allow the detection of several major seismic phases. Future research will focus on subtle coherent arrivals (e.g. the<br />
scattered energy arriving before the phase PP in the distance range 95° to 105°) using a larger number of array recordings.<br />
a) Stacked image for ~500 earthquakes recorded at YKA. Each line represents one new time series calculated from vespagrams.<br />
Stacked seismic phases are sorted by epicentral distance. Larger stack energy is shown in yellow. Zero energy is red. Several<br />
sharp arrivals can be identified. b) Travel-time predictions for major seismic phases in panel a) are labeled.<br />
161


